 Paleodirections: Group-level analyses; pstat and psvar
Programs "pstat" and "psvar" analyze Fisher statistics of group-level data which comprise multiple site-mean paleodirections and VGPs. Input data file should be an output file from "pdirec". Figure below shows an example of "pstat" analysis on the paleodirectional data from Quaternary Taupo Volcano, New Zealand (Tanaka et al., 1996).
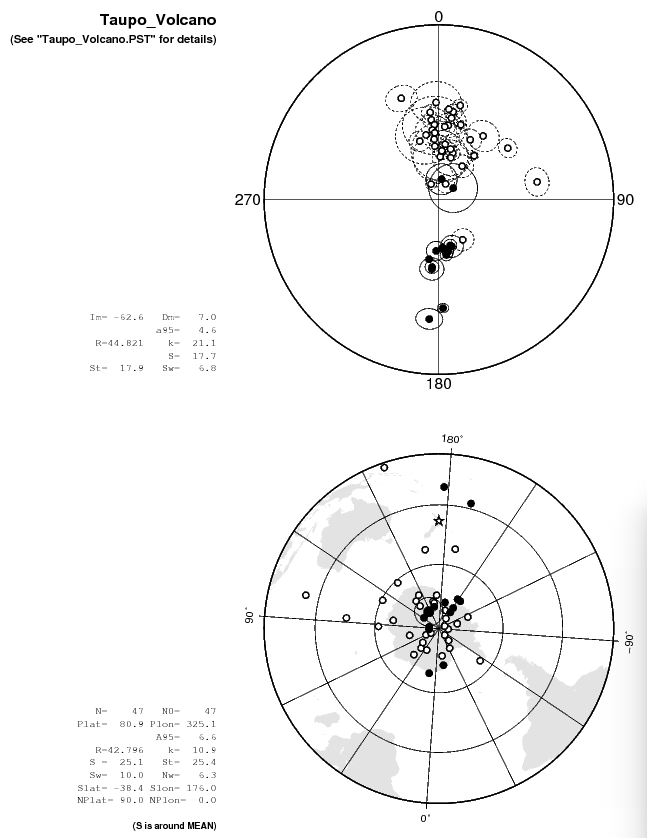
Mean VGP and its confidence \(A_{95}\) are calculated as a group mean and its error from each VGP which corresponds to the site mean direction (i.e., not transferred from the group mean field direction). In the plot, confidence oval of each VGP is not drawn. \(S\) is the angular dispersion of field or VGP, which is calculated by the formula, \[ S^2 = S_T^2 - S_W^2/N_W, \] where \(S_T\), \(S_W\), and \(N_W\) are the between-site dispersion, the root mean square of the within-site dispersion observed at each site, and the mean of the sample number used at each site, respectively. Command S allows to change the center for calculation of \(S\) to any location on the earth (default is the mean). Command V shows the Fisher statistics separately between normal and reversed directions. Command D excludes one datum from the statistics which is the farthest from the mean while command R restores it.
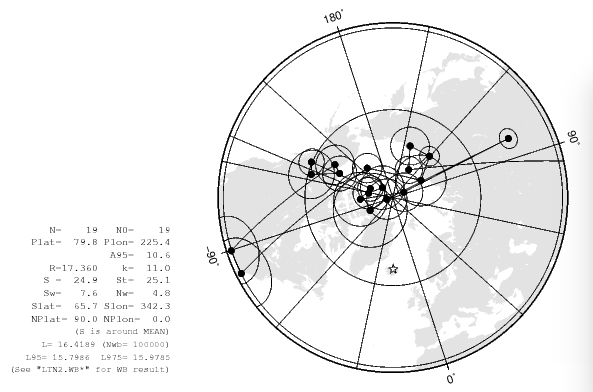
Above figure shows a plot drawn by "psvar" which analyzed the paleodirectional data from Pliocene lava successions in Iceland (Tanaka and Yamamoto, 2016). Difference of "psvar" from "pstat" is that the former draws VGP paths. Confidence oval drawn to each VGP is also the different point from "pstat". The confidence oval is drawn by transferring the circle of \(\alpha_{95}\) of field to pole while the \(A_{95}\) of the group-mean VGP (not shown in the figure) is drawn as a true circle. Another difference of "psvar" is that there is no command to exclude the farthest datum. Command W carries out a serial correlation test of Watson and Beran (1967) to the series of VGPs, in which number of iterations can be changed by command N (default is 2500).
The Fisher statistics analyzed by "pstat" ("psvar") are automatically written to a file "group_name.PST" ("group_name.PSV") with overwrite mode every time the plot is renewed. Results of the Watson & Beran serial correlation test are written to three files named as "group_name" with extensions ".WB", ".WB0", and ".WB1".
Download and installation of the program
References:
- Tanaka, H., G.M. Turner, B.F. Houghton, T. Tachibana, M. Kono, and M.O. McWilliams, Palaeomagnetism and chronology of the central Taupo Volcanic Zone, New Zealand, Geophys. J. Int., 124, 919-934, 1996. (→ doi:10.1111/j.1365-246X.1996.tb05645.x)
- Tanaka, H., and Y. Yamamoto, Palaeointensities from Pliocene lava sequences in Iceland: emphasis on the problem of Arai plot with two linear segments, Geophys. J. Int., 205, 694-714, 2016. (→ doi:10.1093/gji/ggw031)
- Watson, G.S., and R.J. Beran, Testing a sequence of unit vectors for serial correlation, J. Geophys. Res., 72, 5655-5659, 1967.