Introduction: Paleomagnetic Field Observed at Hawaii
Statistical nature of the paleomagnetic field for the last 5 Myr
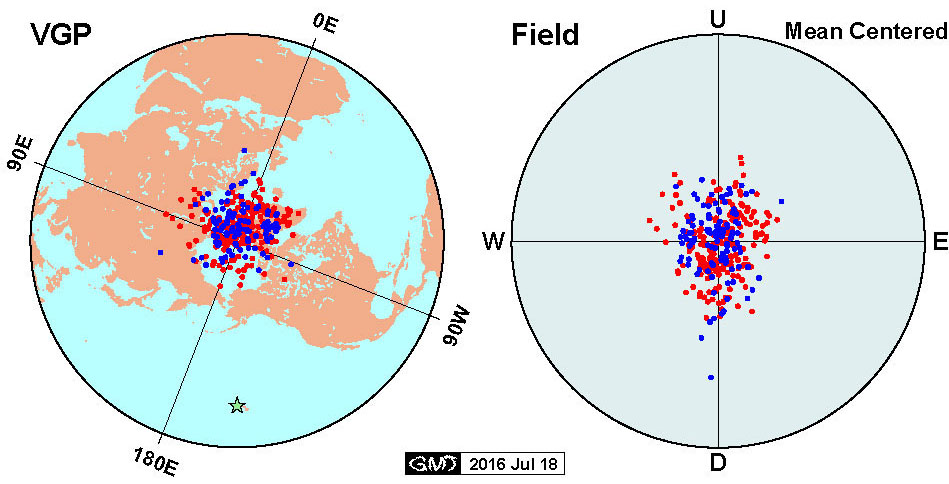
This figure shows distribution of the paleomagnetic field recorded by lavas in Hawaii Island. In the left figure showing the distribution of virtual geomagnetic pole (VGP), red and blue circles indicate S and N poles, respectively. The former and the latter correspond to the normal period (the same field direction as the preset) and the reversed period (opposite to the present field), respectively. Right figure shows the distribution of the paleomagnetic field where the red circle indicates north and downward direction (the same as the present field) and the blue circle indicates south and upward direction (opposite to the present field). Angle of the paleomagnetic field from the horizon is shallow in Hawaii Island of 21°N latitude, but in this figure the directions were projected so that the mean direction comes to the center.
It is noted from this figure that the distribution of VGP is round shape while that of field direction is oval shape along the up-down direction. In fact, the former is well approximated with Fisher distribution (Gauss distribution on a sphere) while the latter is well approximated with Bingham distribution. This fact suggests that the variation of the paleomagnetic field is similar to that produced from stochastic movement of a bar magnet around the center of the earth.
Reference:
- Tanaka, H., Circular asymmetry of the paleomagnetic directions observed at low latitude volcanic sites, Earth Planets Space, 51, 1279-1286, 1999. (→doi:10.1186/BF03351601)