 Paleodirections: Site-level analysis; pdirec
Program "pdirec" analyzes site-level paleodirectional data based on Fisher statistics. The input data file should be an output file from the previous program "pdemag", in which latitude and longitude of the site location should be supplied to the line with "$" at the beginning. To the combined results of line and GTC analyses, the method of McFadden & McElhinny (1988) is applied. An example shown below is from the same dolerite plug referred to in the previous page, in which a site-mean paleodirection and the corresponding VGP is obtained from seven line and eleven GTC sample level results.
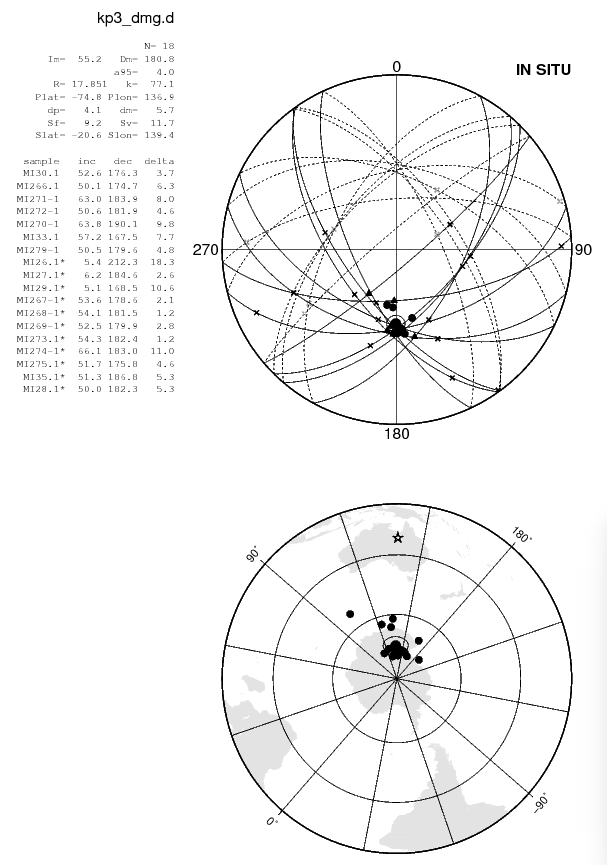
In the plot of VGPs, confidence oval of the mean VGP which corresponds to the mean direction is drawn by transferring a field direction along the \(\alpha_{95}\) circle to a pole. Hence, the confidence oval shown in the plot is slightly different from the oval with semi-axes of \(dp\) and \(dm\). \(S_f\) and \(S_v\) are within-site dispersion of field and VGP, respectively. Command D eliminates one datum which is the farthest from the mean, renewing the plot after recalculation of the statistics, while command R restores the last datum eliminated. Successive application of D commands often reduces the \(\alpha_{95}\) but the program does not give any hint to justify this. You should do a statistical test separately.
Download and installation of the program
Reference:
- McFadden, P.L. and M.W. McElhinny, The combined analysis of remagnetization circles and direct observations in paleomagnetism, Earth Planet. Sci. Lett., 87, 161-172, 1988.