 Analysis of Thellier results: pinte
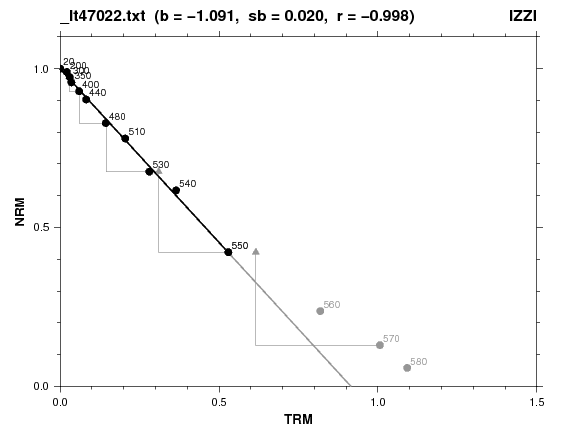
Program "pinte" analyzes results of paleointensity experiment by Thellier's method (Thellier and Thellier, 1959). The program works on three data format; those from experimental protocols of ZI (Coe et al., 1978), IZ (Aitken et al., 1988), and IZZI (Tauxe & Staudigel, 2004). The data format should be common throughout a file and should be assigned at the beginning of the file. Magnetic susceptibility measured at every step can be included in each data line, but plot of \(\chi-T\) curve should be invoked by starting the program as "pinte -C input_file". Selecting the linear segment on the Arai plot (Nagata et al., 1963) is carried out by manual line fitting of command L. Considering the ongoing debate on the reliability of Thellier's experiments, various parameters are estimated along with the usual quality factors of Coe et al. (1978) to help to judge the goodness of the results. The estimated parameters are automatically written to a file "sample_name.PI" every time the plot is renewed. Figure below is an example of Arai plot from an Icelandic basalt sample (Tanaka and Yamamoto, 2016). In the experiment, MD tail check was omitted, though the program involves a function to analyze it.
One of the parameters which is used to evaluate the paleointensity result is the curvature of the segment when fitted by a circle (Paterson, 2011). In the circle fitting, the program uses a C code of the method of Taubin (1991) which was modified from the C++ code of Chernov (2012). Figure below is an example of circle fitting by command C applied to the same data as shown above over the whole temperature range.
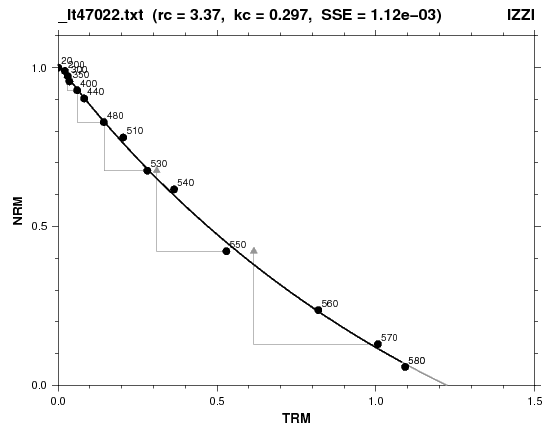
In the Arai plot above, it is obvious that the fitted circle has quite a large curvature, or a small radius (\(r_c\)=3.4). However, it should be avoided to reject these data out of hand just because of the large curvature of the Arai plot. It is my opinion that curved Arai plots are mostly caused by physical or chemical alteration of the samples, not by a genuine MD or PSD effect. In fact, the curvature of the fitted circle is much reduced (\(r_c\)=12.9) if the data points between 20°C and 550°C are taken, which is the same range taken in the line analysis shown in the above first plot. Considering that VRM (viscous remanent magnetization) might have affected the low temperature part, if the temperature range is further confined to 350°C-550°C, the data points virtually lie on a straight line (\(r_c\)=330).
Download and installation of the program
References:
- Aitken, M.J., A.L. Allsop, G.D. Bussell, and M.B. Winter, Determination of the intensity of the earth's magnetic field during archaeological times: reliability of the Thellier technique, Rev. Geophys., 26, 3-12, 1988.
- Chernov, N, Fitting ellipses, circles, and lines by least squares, 2012. (→ http://people.cas.uab.edu/~mosya/cl/index.html)
- Coe, R. S., S. Gromme, and E. A. Mankinen, Geomagnetic paleointensities from radiocarbon-dated lava flows on Hawaii and the question of the Pacific nondipole low,J. Geophys. Res., 83, 1740-1756, 1978.
- Nagata, T., Y. Arai, and K. Momose, Secular variation of the geomagnetic total force during the last 5000 years, J. Geophys. Res., 68, 5277-5281, 1963.
- Paterson, G.A., A simple test for the presence of multidomain behavior during paleointensity experiments, J. Geophys. Res., 116, B10104/10.1029/2011JB008369, 2011.
- Tanaka, H., and Y. Yamamoto, Palaeointensities from Pliocene lava sequences in Iceland: emphasis on the problem of Arai plot with two linear segments, Geophys. J. Int., 205, 694-714, 2016. (→ doi:10.1093/gji/ggw031)
- Taubin, G., Estimation of planar curves, surfaces and nonplanar space curves defined by implicit equations, with applications to edge and range image segmentation, IEEE Trans. Pattern Analysis Machine Intelligence, 13, 1115-1138, 1991.
- Tauxe, L., and H. Staudigel, Strength of the geomagnetic field in the Cretaceous Normal Superchron: New data from submarine basaltic glass of the Troodos Ophiolite, Geochem. Geophys. Geosystems, 5, GC000635, 2004.
- Thellier, E., and O. Thellier, Sur lintensite du champ magnetique terrestre dans le passe historique et geologique, Ann. Geophys., 15, 285-376, 1959.