Tenured Professor at
The Open University of Japan
PROJECT II
Long-term trend analysis
| Long-term Trend Analysis using Tokyo Datum |
The analysis so far has examined the population trends since 1995 using
the data of the World Geodetic System. This short-term analysis from 1995
to 2000 is somewhat meaningful in the sense that I can capture the trend
after the collapse of the bubble economy. However, what is the population
trend of urban areas in Japan since the period of high economic growth?
A longer-term trend should be confirmed.
In order to do this, it is first necessary to address the limitations of
the data. To conduct long-term analysis, it is required to use Tokyo Datum
to obtain data from before 1995. However, the problem is that the position
of the mesh set in Tokyo Datum is displaced about 400 meters to the northwest
of the World Geodetic System (WGS). Due to mdbUA2010 being created based
on the World Geodetic System in 2010, applying the Tokyo Datum coordinates
to the mesh as is would result in a 400 meter shift in its actual position.
In fact, it was found that the populations of urban areas where Tokyo Datum
coordinates were fitted were less than those obtained using the WGS.
Despite such limitations, since the trend of each year-point can be confirmed as being the same as that conveyed by the data of the World Geodetic System, applying Tokyo Datum coordinates to urban areas demarcated based on the WGS can be acceptable for analysis. It might be better to reset the urban areas using Tokyo Datum; however, after 2005, data are available only from the WGS. Therefore, I have adopted an approximate and convenient method of combining the two.
| Long-Term Population Trends |
Meshed data of the census on Tokyo Datum are available from 1970 to 2005. Populations were calculated for each urban area every five years from 1970 to 2005, and a line graph was created and analyzed.
Population trends were classified into several categories based on the three patterns elucidated previously, these being namely Consistent Increase, Consistent Decrease, and Other(s), ranging from a sustained pattern to those situations when population increases or decreases up to a certain point in time. In determining the type of trend, it is possible to classify patterns based on the point of change and whether the shift marks the beginning of growth or decline or marks a change to a steadier, sustainable type. Accordingly, we can consider the population trend of each urban area.
Firstly, there is the simple, “Consistently Increasing type”, comprising urban areas that have experienced steady population growth since 1970, which marked the end of the period of high economic growth, through the period of bubble economy until 2005.
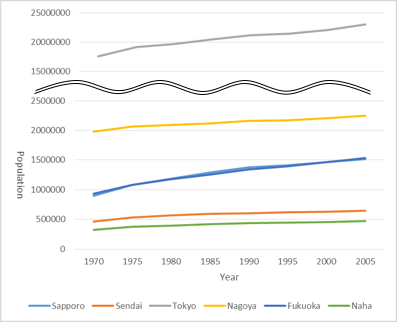 The Consistently
Increasing Type includes the following 42 urban areas:
The Consistently
Increasing Type includes the following 42 urban areas:
Sapporo; Sendai; Koriyama; Tsukuba; Ushiku;
Utsunomiya; Nagareyama; Narita; Chiba; Okegawa; Kawagoe; Iruma; Fukaya; Ome;
Tokyo; Atsugi; Hadano; Hiratsuka; Mishima; Yaizu; Toyokawa; Okazaki; Anjo;
Toyota; Handa; Nagoya; Kusatsu; Otsu; Kashihara; YamatoTakada; Yonago; Okayama;
Kurashiki; Fukuyama; Higashihiroshima; Hiroshima; Matsuyama; Fukutsu; Fukuoka;
Itoshima; Kumamoto; and Naha.
In addition, after long periods of relative stagnancy, populations have
been increasing in Sanda, Fuji, Ichinomiya, and Himeji since 1985 or 1990.
Together, these 46 centers can be characterized as “Expanding Cities”
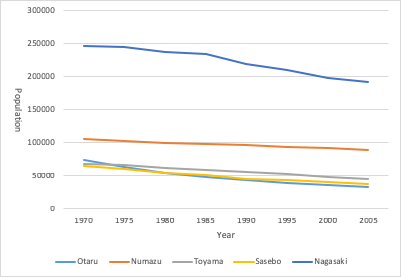 Then, there is another simple pattern as follows
which is exhibited by these 11 urban areas characterized as Consistently Decreasing:
Then, there is another simple pattern as follows
which is exhibited by these 11 urban areas characterized as Consistently Decreasing:
Otaru; Hachinohe; Nagaoka; Numazu; Toyama; Takaoka; Gifu; Shimonoseki;
Kitakyushu; Sasebo; and Nagasaki
These 11 centers can be characterized as "Contracting Cities".
Moreover, relatively stable/sustainable urban areas can be considered,
including those experiencing slight increases or decreases in population.
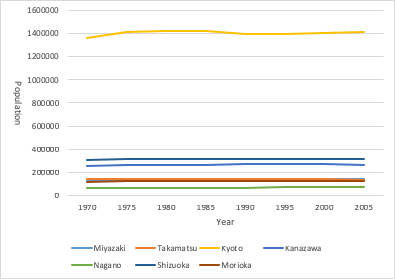 The following 18 urban areas are categorized as the
stable type:
The following 18 urban areas are categorized as the
stable type:
Morioka; Yamagata; Fukushima; Niigata; Takasaki; Kamakura; Nagano; Shizuoka;
Hamamatsu; Toyohashi; Yokkaichi; Matsusaka; Kyoto; Osaka/Kobe; Takamatsu;
Kochi; Kurume; and Beppu
Similarly, urban areas that have experienced a
shift from contracting or expanding trends to more stable populations can be
considered among this group. Among the former type are Matsue and Kure.
Although a number of cities exhibited a shift from expanding to more stable
populations, seven cities meet the criteria of stable trends beginning before
1990, namely Yokosuka, Kanazawa, Uji, Saga, Miyazaki, Kagoshima, and Okinawa.
Together, these 27 cities are classified as “Stable/Sustainable Cities”.
Next, I will consider cities where the population began to decrease after
a certain point in time.
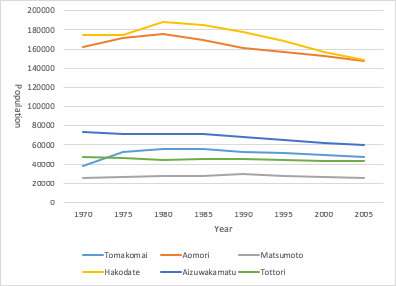 There are eight cities where populations have
experienced a shift from population growth to decline since 1980, and these are
namely: Kushiro; Tomakomai; Aomori; Ishinomaki; Mito; Matsumoto; Kofu; and
Wakayama.
There are eight cities where populations have
experienced a shift from population growth to decline since 1980, and these are
namely: Kushiro; Tomakomai; Aomori; Ishinomaki; Mito; Matsumoto; Kofu; and
Wakayama.
Another 11 cities experienced a shift from steady population to decline in population after 1980, these being namely: Asahikawa; Hakodate; Akita; Hirosaki; Aizuwakamatsu; Maebashi; Shimizu; Shunan; Fukui; Tokushima; and Tottori.
These 19 centers are classified as “Converted Contraction Cities”.
Now, we can consider those cities where populations have changed since
1995 and after the collapse of bubble economy.
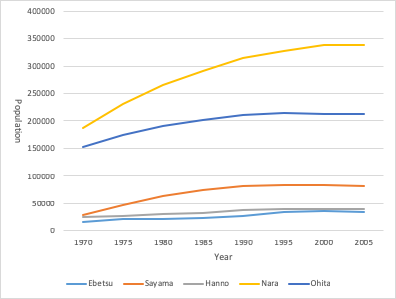 In some cases, cities where population had been
expanding began to stagnate since 1995, such as Ebetsu, Kasukabe, Iwatsuki,
Tsurugashima, Sakado, Sayama, Hanno, Kanazawahakkei, Isehara, Odawara, Kameoka,
Ikoma, Nara and Oita.
In some cases, cities where population had been
expanding began to stagnate since 1995, such as Ebetsu, Kasukabe, Iwatsuki,
Tsurugashima, Sakado, Sayama, Hanno, Kanazawahakkei, Isehara, Odawara, Kameoka,
Ikoma, Nara and Oita.
These 15 cities are categorized as “Converted Stagnant Cities”.
Overall, the analysis of long-term trends based on Tokyo Datum resulted in the following classification of patterns of population transition at the 118 urban areas:.
1. Expanded Cities: 46
2. Sustainable/Stable Cities: 27
3. Converted Stagnant Cities: 15
4. Converted Contracting Cities: 19
5. Contracting Cities: 11
Based on the reasonable number of expanding and stable/sustainable cities, it can be suggested that the status of Japanese urbanization remains healthy. However, considering long-term trends, the growth of urban areas has been slowing as a whole, as nearly 40% of the cities are experiencing shrinking or stagnating populations. .
Then, what are the regional distributions of each type?
![]()
ConTAct us AT
Prof. Kazushi Tamano
2-11 Wakaba Mihama-ku
Chiba-City, Chiba, Japan 261-8586
(The Open University of Japan)
tamano@k.email.ne.jp