Tenured Professor at
The Open University of Japan
PROJECT II
Distribution Map of Population Trends
| Distribution of the Five Population Trends |
After examining long-term population trends based
on Tokyo Datum coordinates, the pattern of each city of population transition
from 1970 to 2005 could be divided into the following five color-coded
categories:
1. Expanded Cities: 46 Blue
2. Sustainable/Stable Cities: 27 Light Blue
3. Stagnant Converted Cities: 15 Orange
4. Reduction Converted Cities: 19 Pink
5. Reduced Cities: 11
Red
The nationwide map illustrates the color coded cities below.
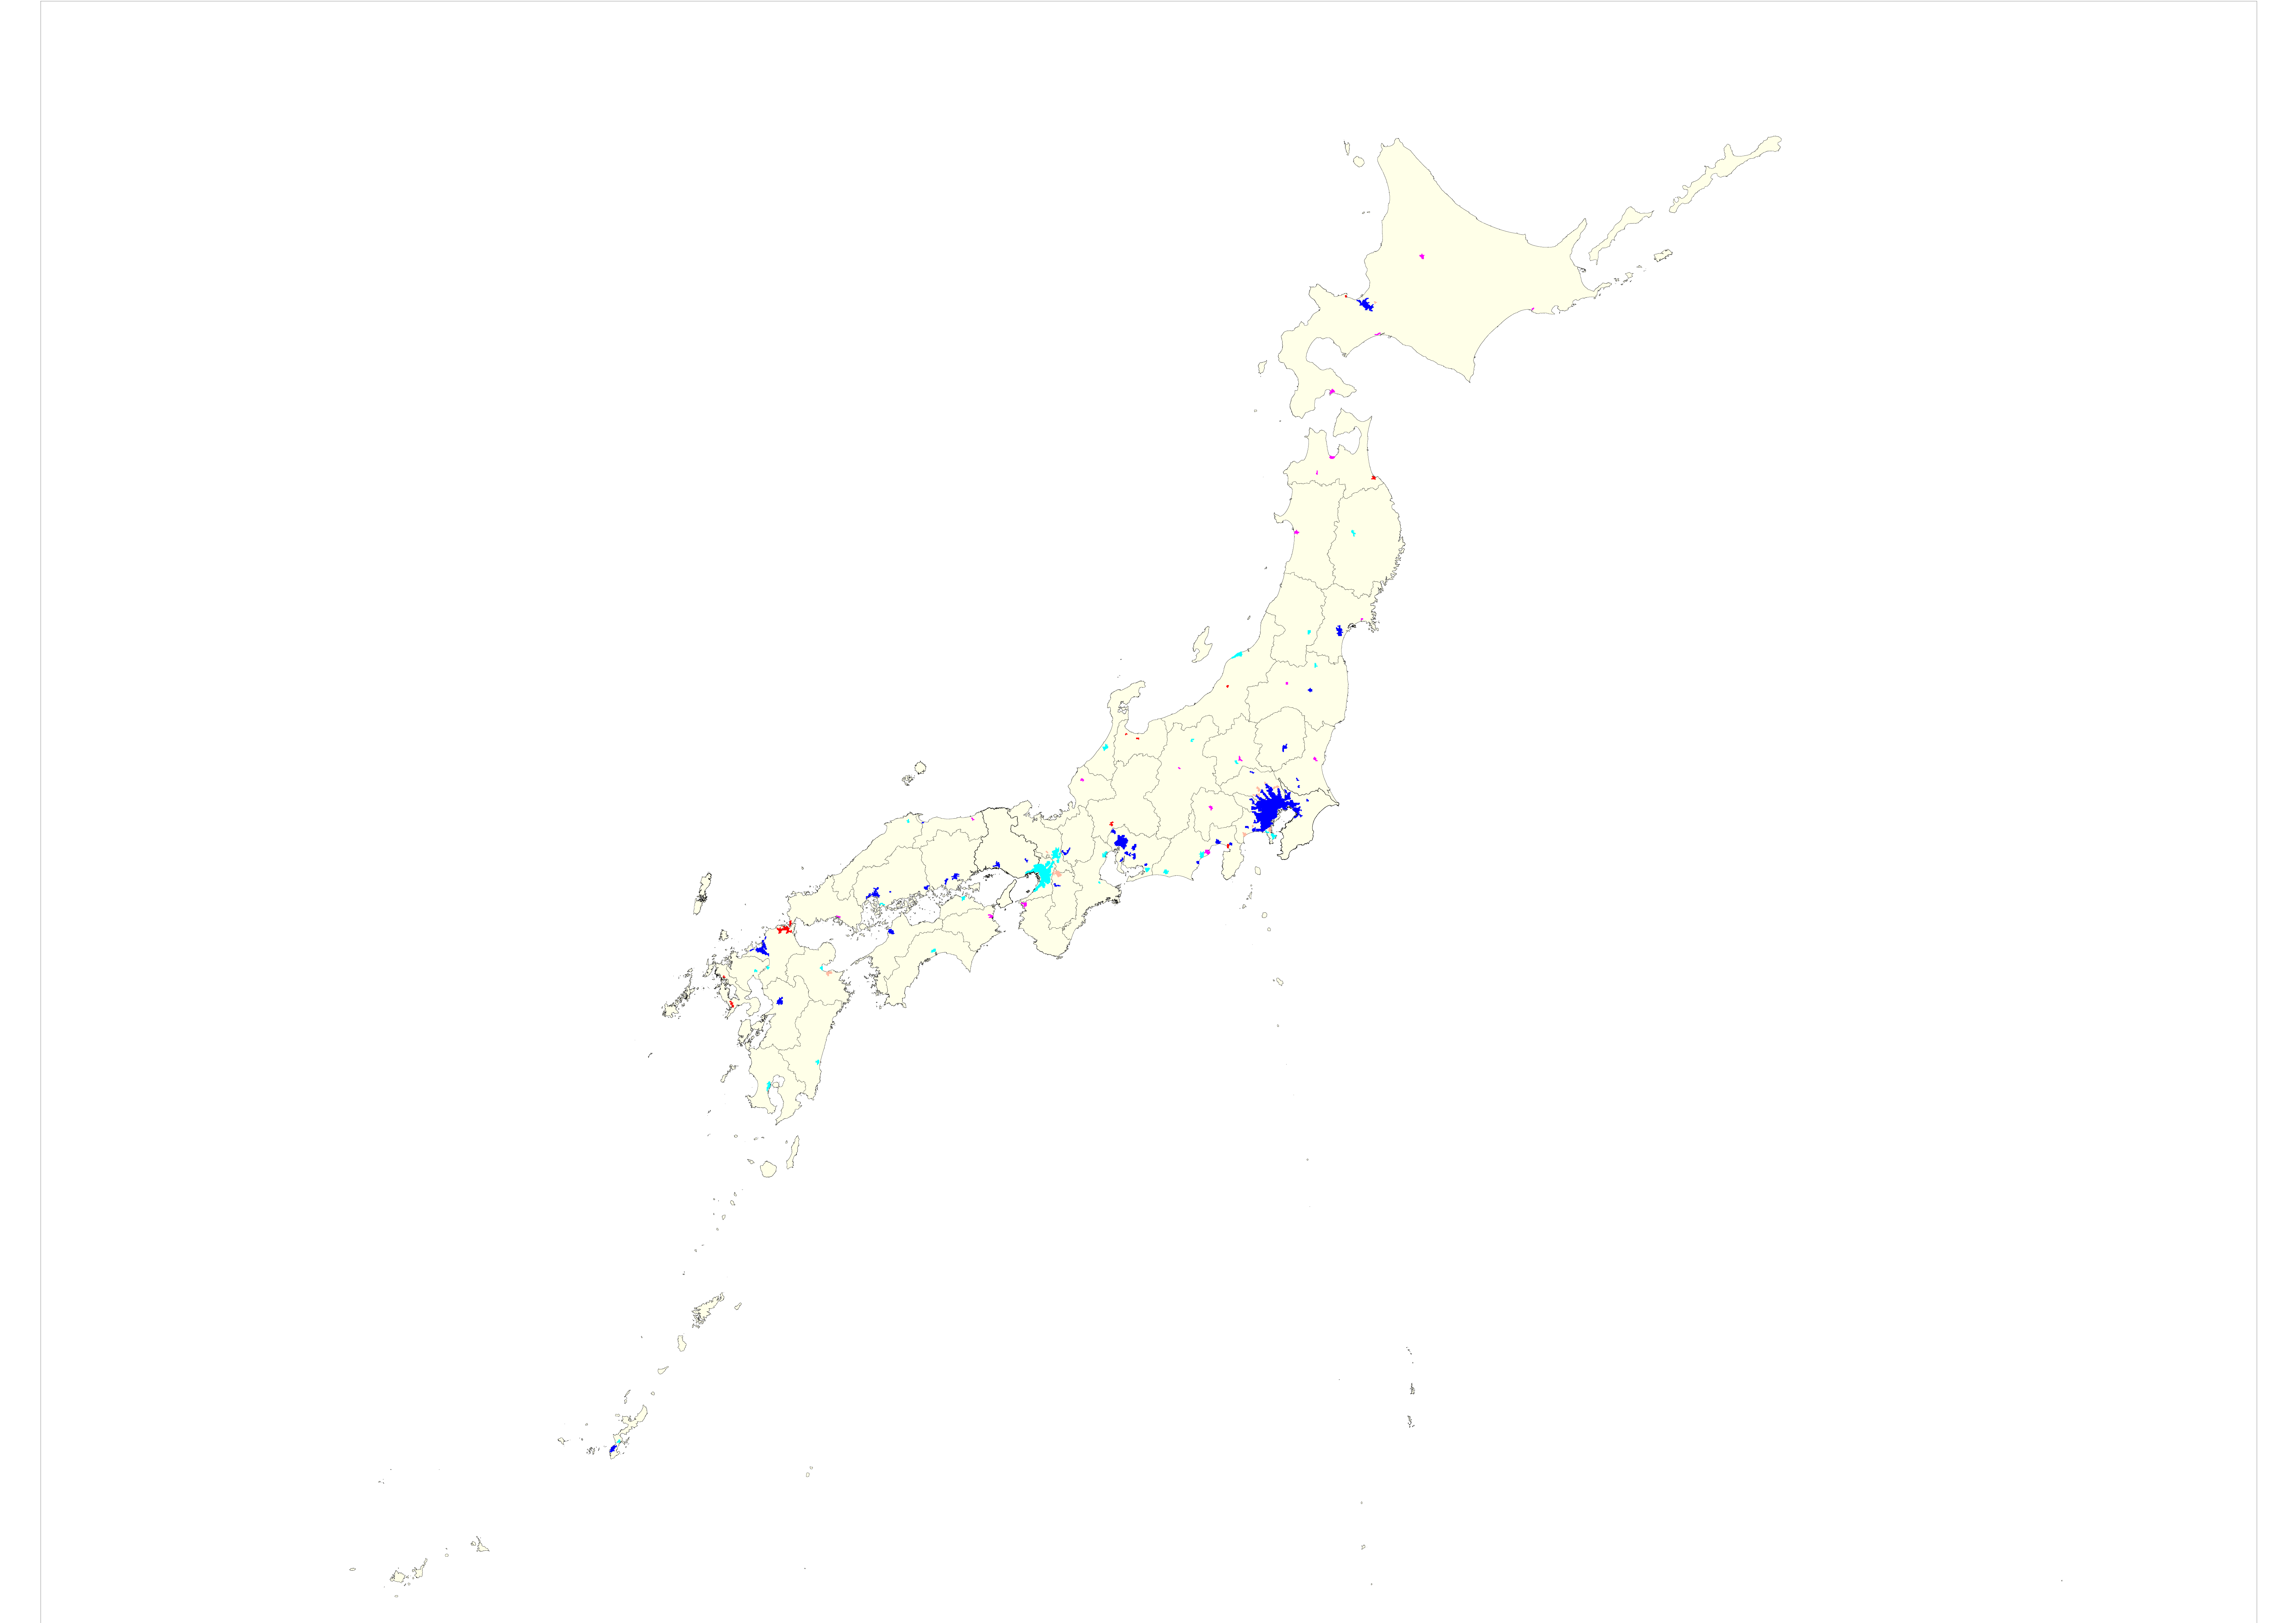
Color-coded nationwide map showing long-term
patterns of population transition
※click on the map to open
an enlarged version
Type 1, Expanded Cities (blue), is distributed in the Pacific Coastal belt zone, including Tokyo, Nagoya, and Fukuoka, as well as in regional metropolitan areas such as Sapporo Sendai, Kumamoto, Naha, and a few others.
Type 2, Sustainable/Stable Cities (light blue), is found in the Tohoku, Hokuriku, Shikoku, and Kyushu areas as well as in some centers in the Pacific Coastal belt zone. In particular, regional cities belonging to this type are expected to play a role as regional core areas. Notably, among the three major metropolitan areas, only Osaka/Kobe belong to this type.
Type 3, Converted Stagnant Cities (orange), shows a very interesting distribution. Excepting for Oita and Ebetsu in the suburbs of Sapporo, all the other cities in this category are located in the suburbs of metropolitan areas such as Tokyo and Osaka. It is a remarkable result, although it cannot be confirmed whether or not this trend can be regarded as an indication that the growth of Japanese metropolitan areas has weakened since the 1990s.
Type 4, Converted Contracting Cities (pink), are widely distributed primarily in local centers. Since the downsizing conversion does not always begin after the 1990s, it seems that the populations of many local cities have shifted toward a decline from being stable or from expanding after a period of high growth. Notably, differences can be seen even among local cities of similar types nearby, whereby some have maintained the population and others have been contracting in size.
Type 5, Contracting Cities (red), also encompasses some local centers, including areas in the Pacific Coastal Belt zone that were previously prosperous due to heavy industries, such as Kitakyushu, Nagasaki, and Sasebo.
| Main findings and future issues |
In addition to a trend analysis from 1995 onwards that was based on the
data of the WGD System, I have here described the results of a longer-term
trend analysis from 1970 onwards using the data of Tokyo Datum. Now, I
would like to consider some implications of this longer-term trend analysis
as well as some future tasks..
The results of the “dual dimension assessments” describing the population concentrations in the Pacific Coastal Belt zone and the major metropolitan areas by region, including Sapporo and Fukuoka, are similar to those of the longer-term analysis. However, among the metropolitan areas, only Osaka/Kobe can be classified as being sustainable or stable cities from a long-term perspective.
As in the preceding analysis, some regional cities have been relatively successful in maintaining their populations because they are located at moderate distances from the metropolitan areas and other regional cities. However, the long-term analysis identified a number of local cities that are experiencing declines in population. Therefore, it is important to examine the differences between conditions in both types of cities when discussing trends that are impacting regional core cities.
In addition, one finding that became clear for the first time through the use of long-term trend analysis was that population growth in many cities around the greater metropolitan areas appears to have hit a ceiling around 1990. However, thus far it is not clear whether this is an indication of the overall growth potential of metropolitan areas having slowed since the 1990s. This is an important point for future studies, particularly in considering concepts such as a “super mega-region”.
This presentation is the result of analyses of urban population trends that are made possible based on the meshed data of mdbUA 2010. On the basis of these fundamental findings, I hope to continue assessing the factors that have shaped the current situations of Japanese cities.
ConTAct us AT
Prof. Kazushi Tamano
2-11 Wakaba Mihama-ku
Chiba-City, Chiba, Japan 261-8586
(The Open University of Japan)
tamano@k.email.ne.jp