Tenured Professor at
The Open University of Japan
PROJECT II
Findings on population trend anarysis
| Distribution of Population Trends |
As described above, population transition at four points from 1995-2010 was classified into three types: Consistent Increase; Consistent Decrease; and “Others”. By calculating the gap between the maximum and minimum values of the change ratio as a standard score, I classified urban population trends into five categories: (1) consistent increase with greater change; (2) consistent increase with smaller change; (3) consistent decrease with greater change; (4) consistent decrease with smaller change; (4) other.
The country map below shows each of these five categories as being represented by a different color, such that blue denotes the Consistent Increase type and red represents the Consistent Decrease type. Darker shades indicate greater degrees of change whereas smaller changes are represented by lighter shades and Other types are indicated in black.
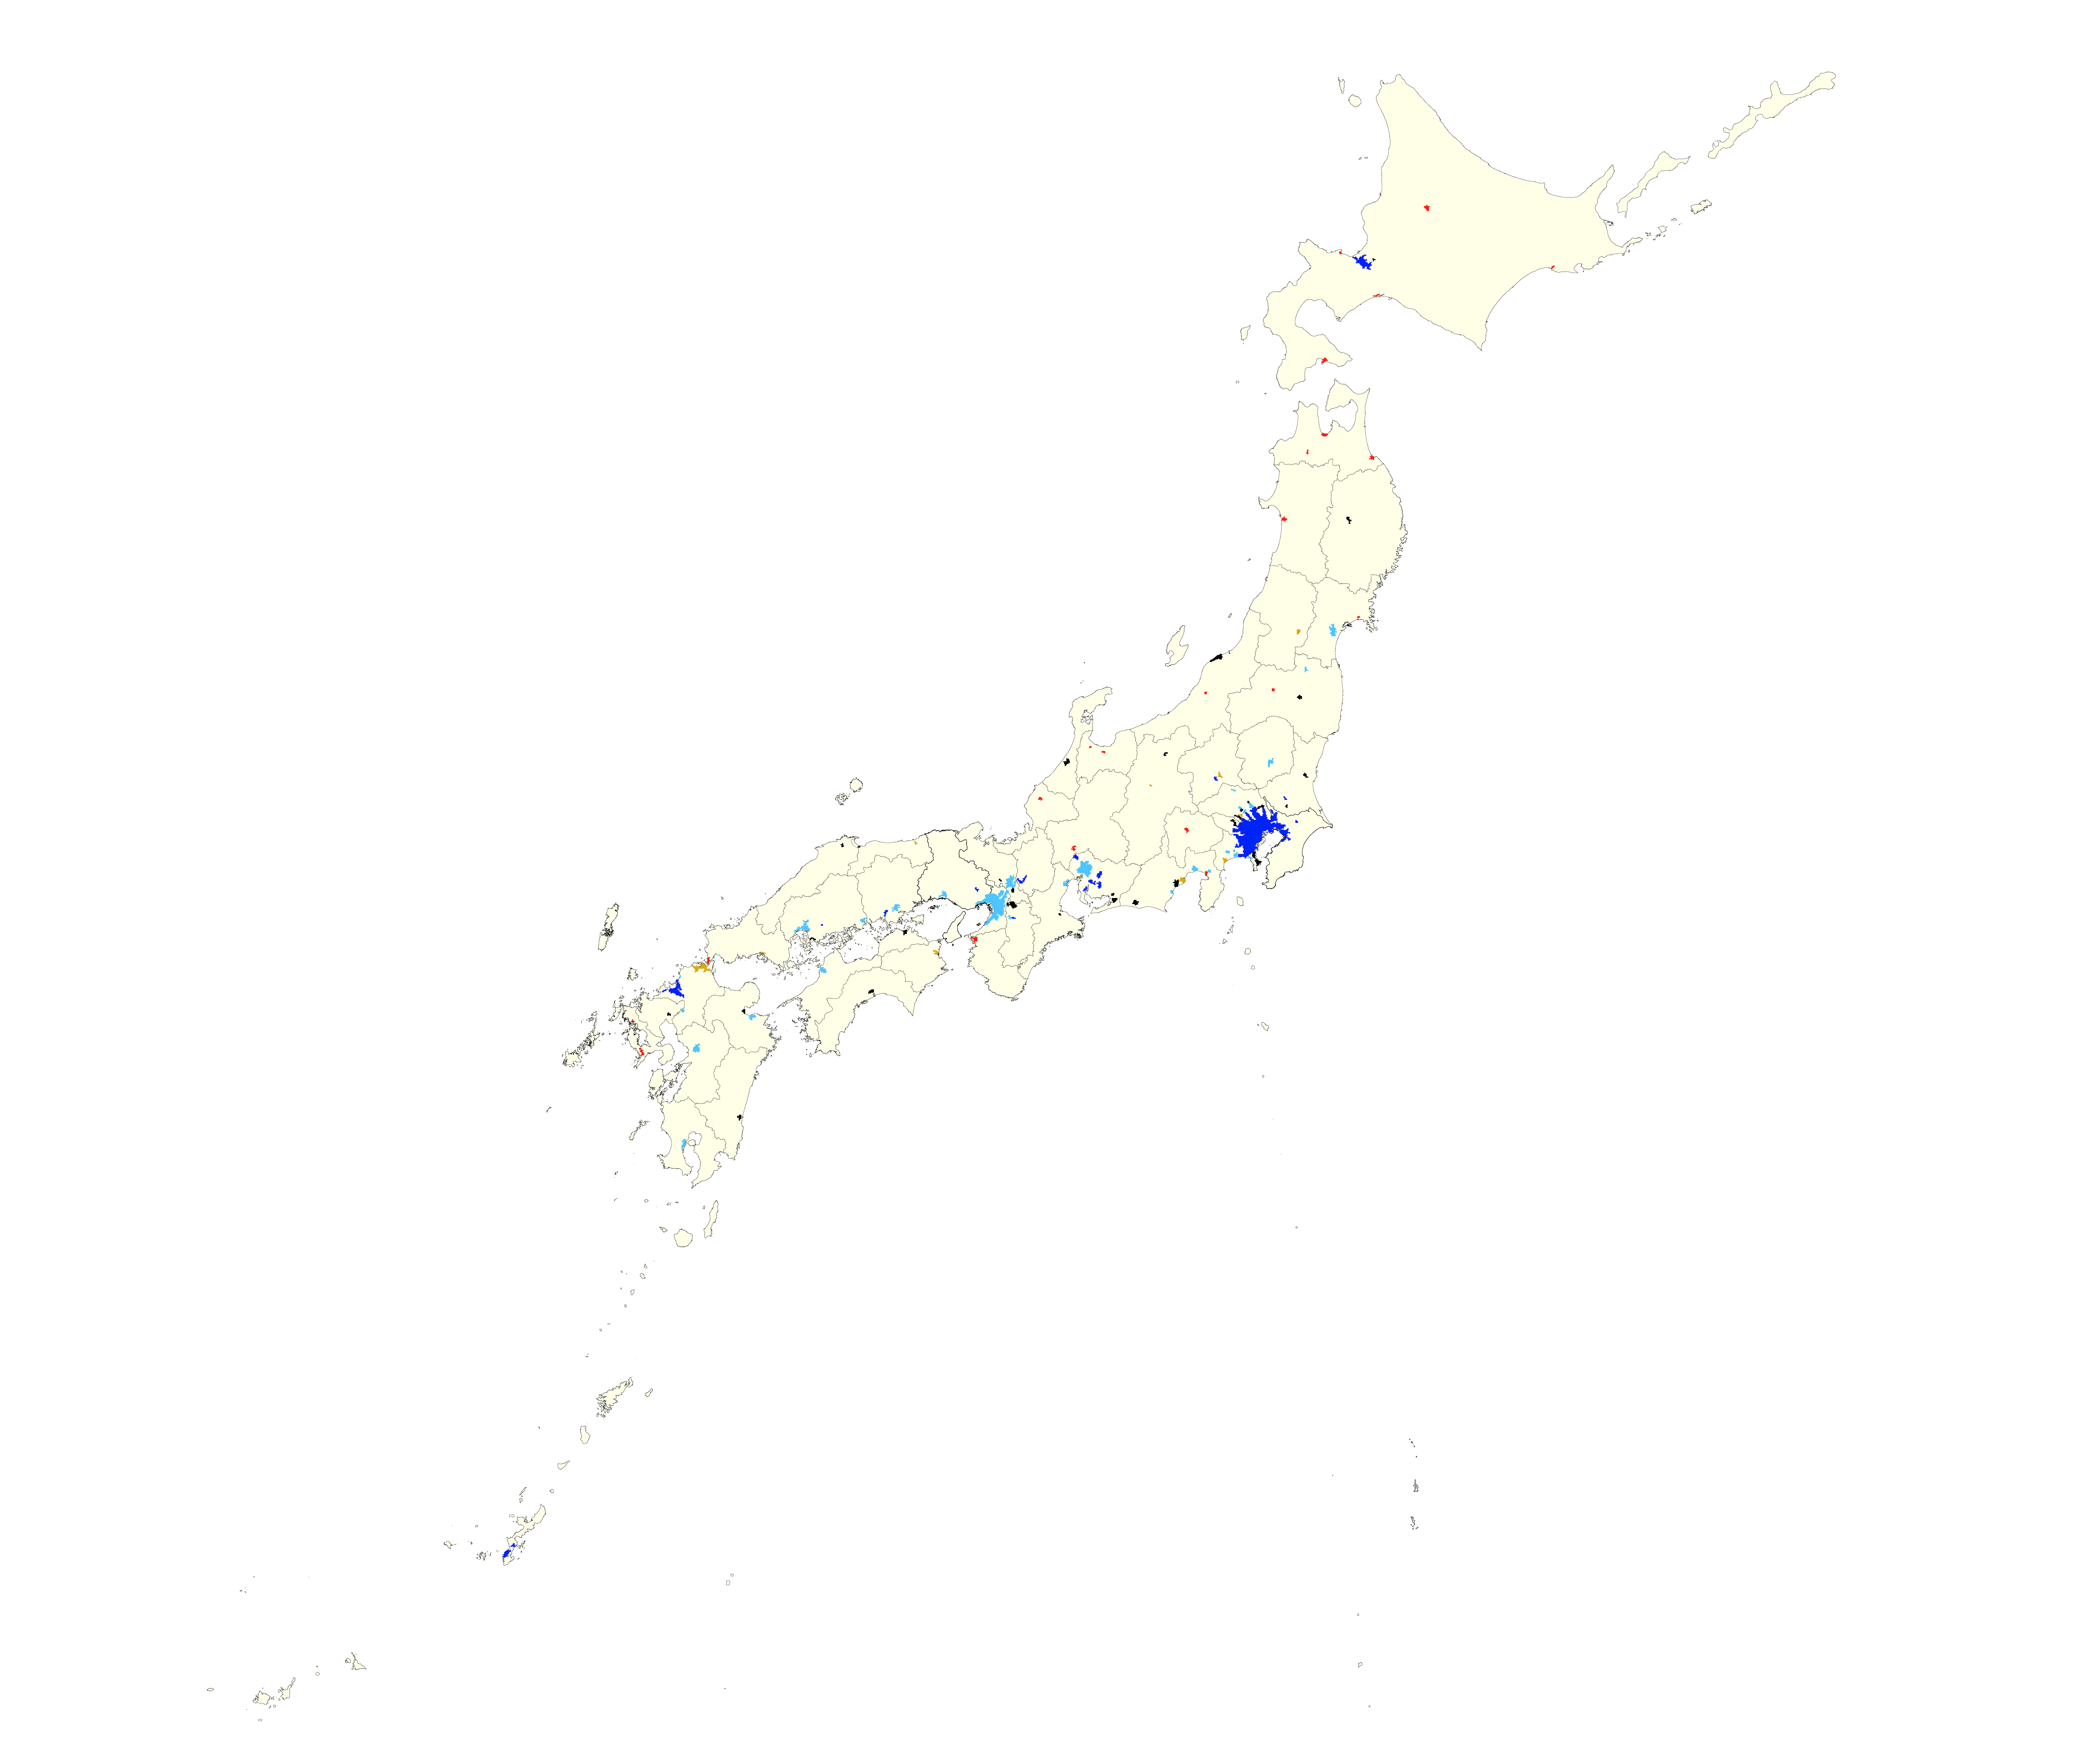
Nationwide map illustrating population trends from
1995-2010
※click on the map to open
an enlarged version
The distribution of cities for each of the five types is as follows: Among the 52 Consistent Increase cities, 23 exhibited greater degrees of change, whereas the remaining 29 showed less change. Among the 32 Consistent Decrease cities, 22 demonstrated greater changes, whereas 10 illustrated smaller changes. Other types comprised 34 cities. Overall, cities demonstrating remarkable growth and those cities exhibiting drastic declines each comprised about 20% of the nation’s urban areas, whereas about 30% of the cities experienced slight but steady increases in populations, another 30% of the cities had fluctuating populations, and about 10% of the cities experienced slow declines in populations..
The maps are enlarged regionally below..
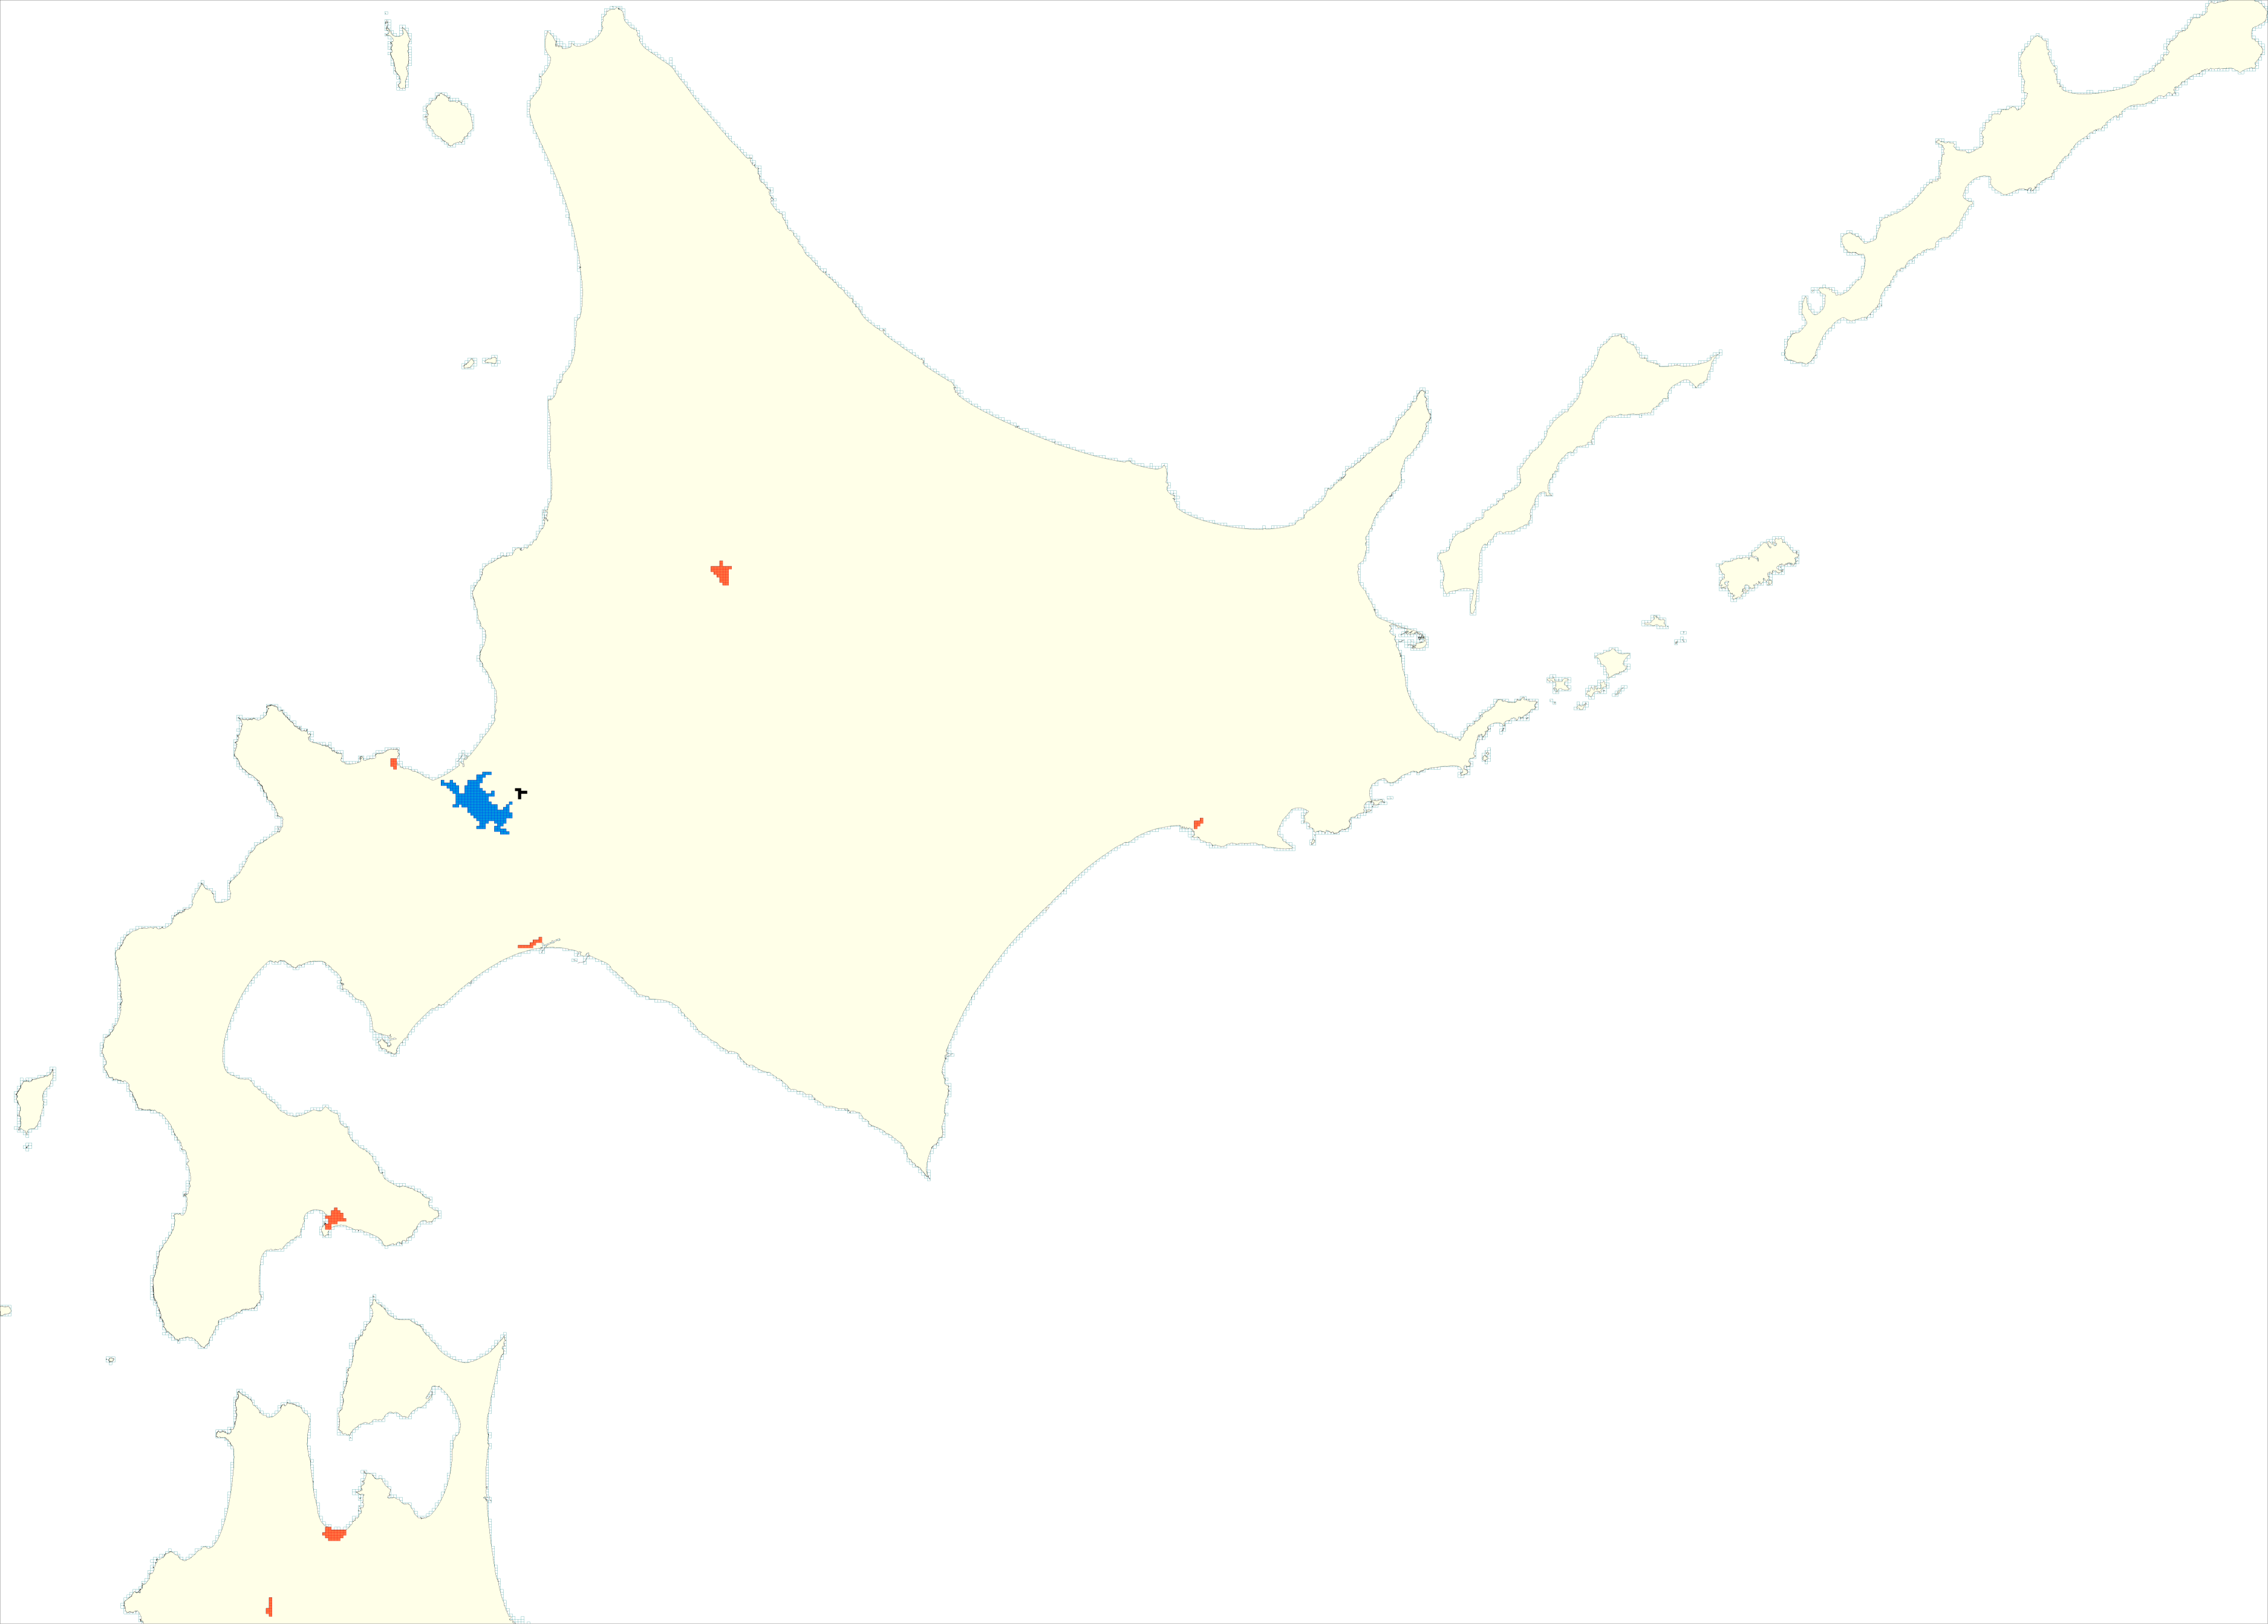
In Hokkaido, only Sapporo’s population consistently increased. Except for
Ebetsu in the suburbs of Sapporo, all other cities show a consistently
decreasing population. The aggregation of population at Sapporo is clearly
visible.
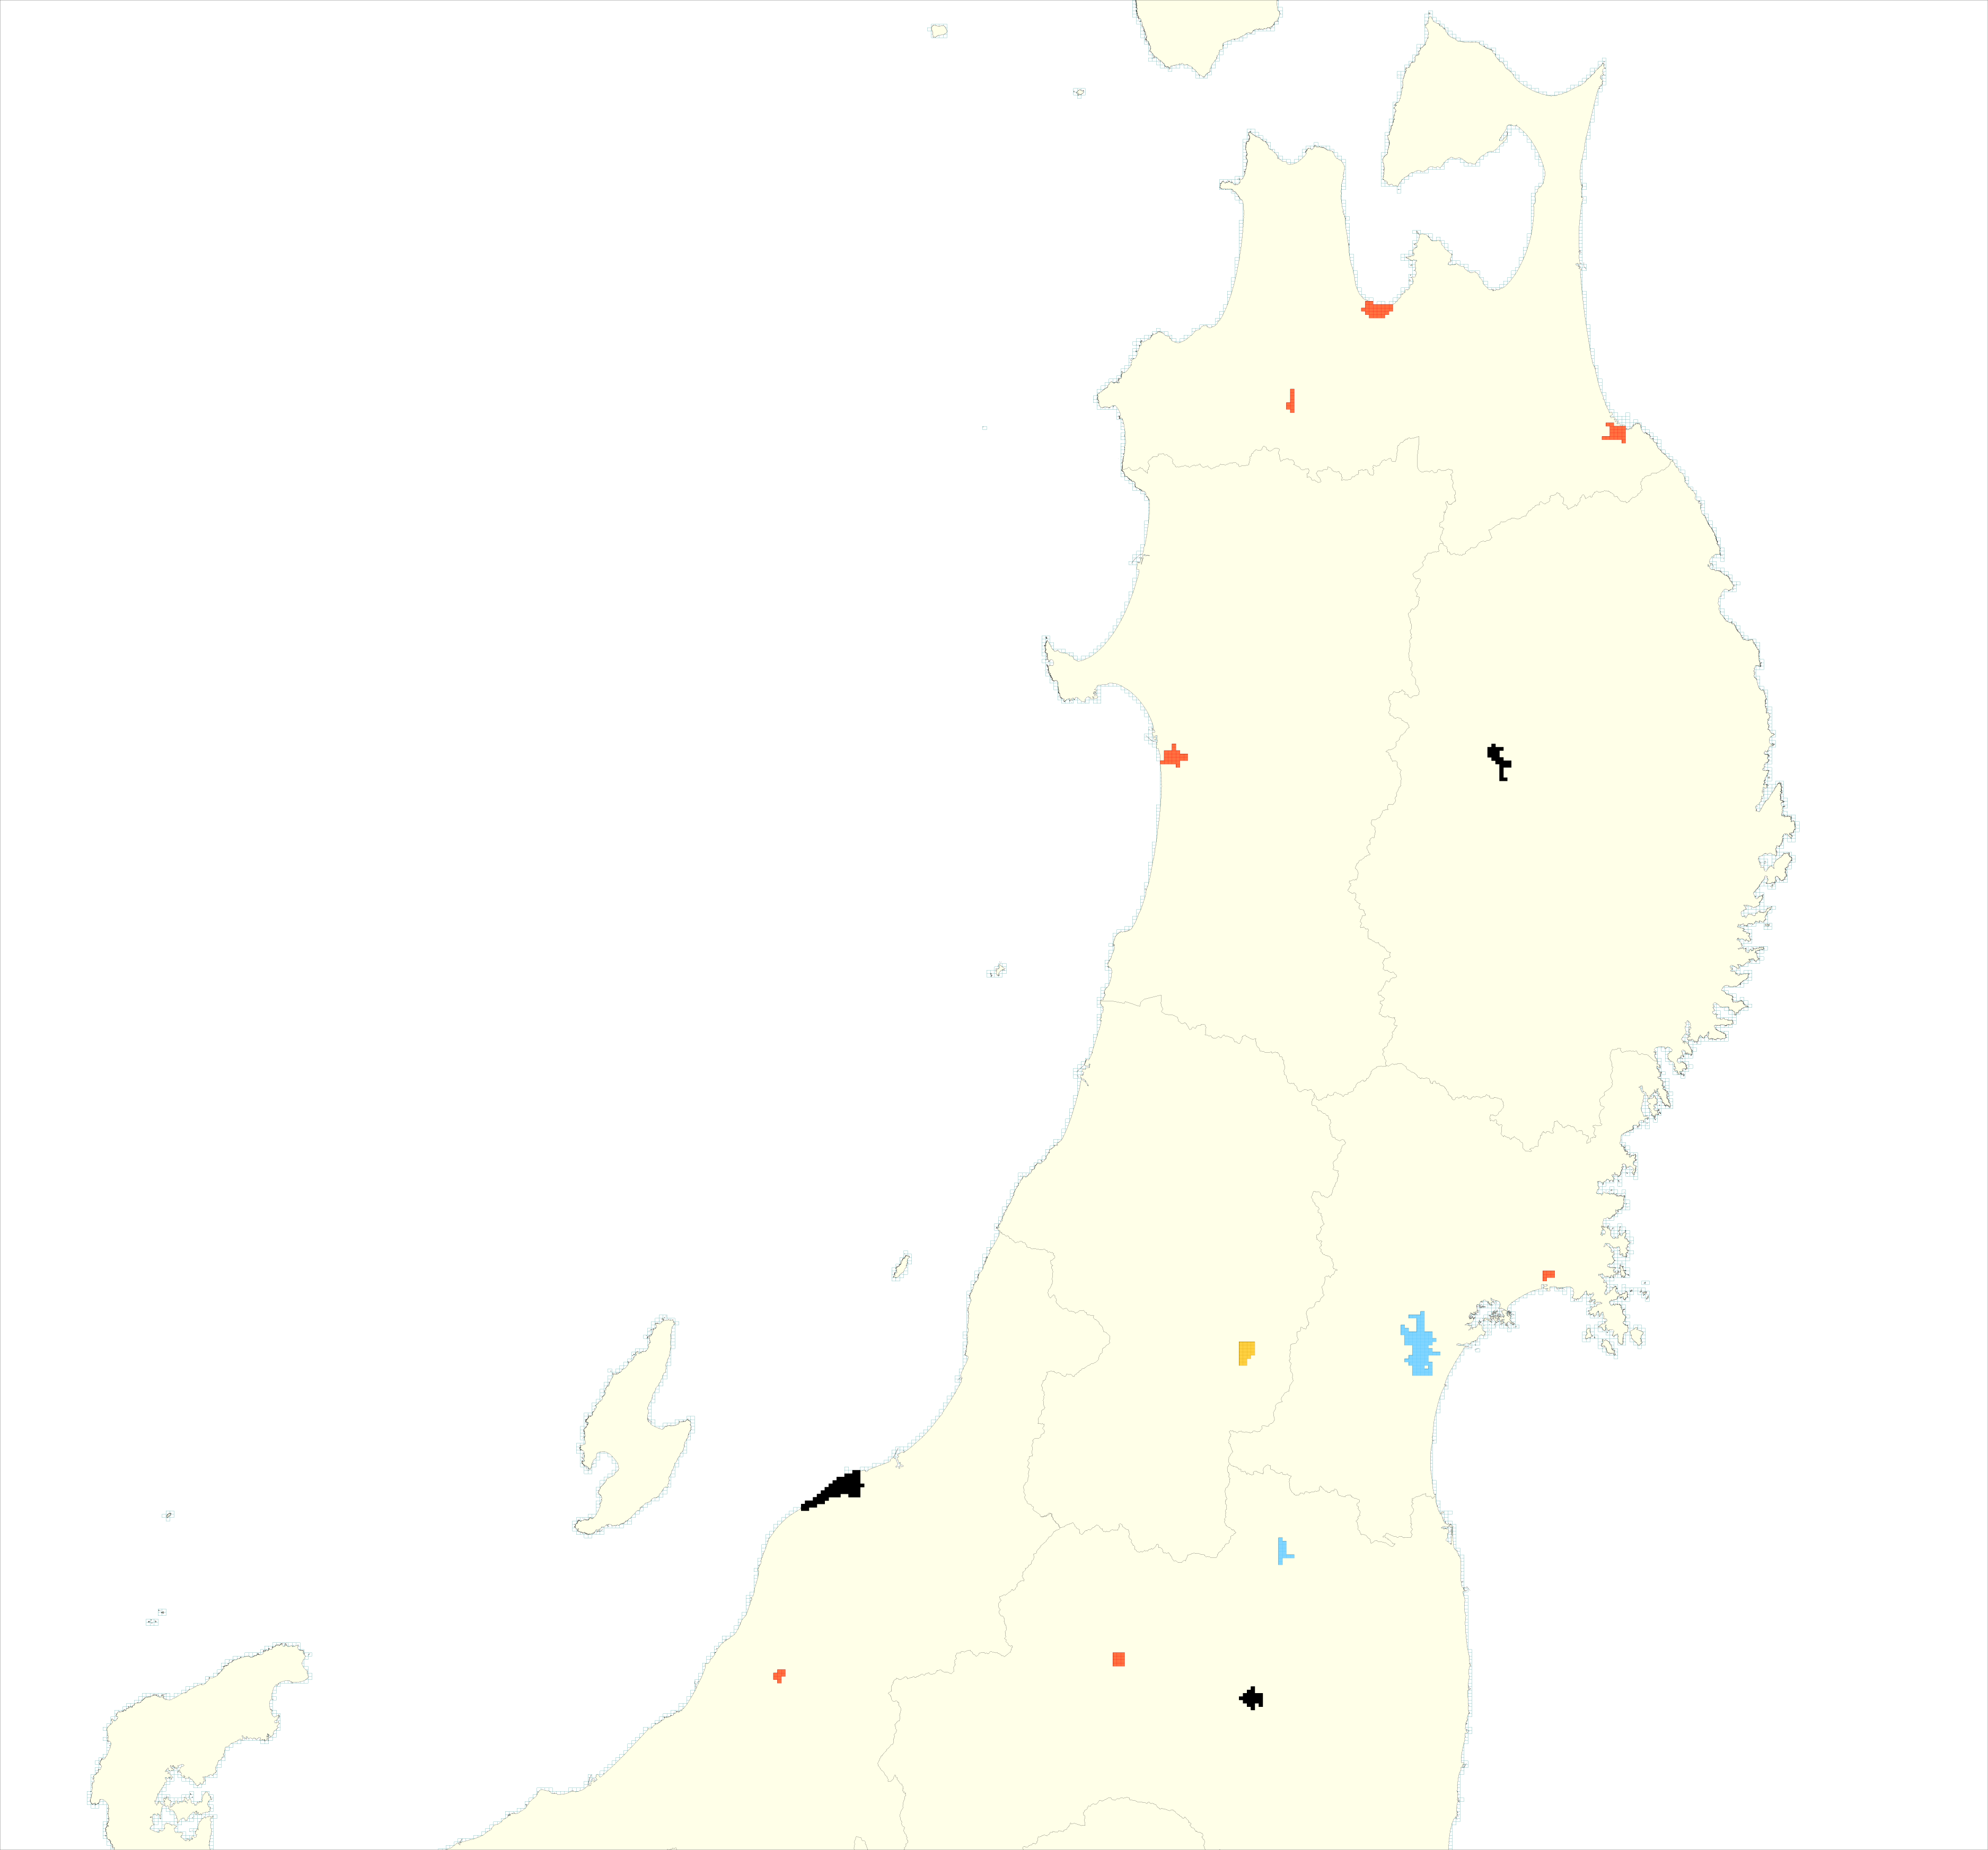
In Tohoku, only Sendai and Fukushima show evidence of slight, albeit consistently
increasing, population. Except for at Yamagata and Koriyama, the populations
of other cities consistently decreased.
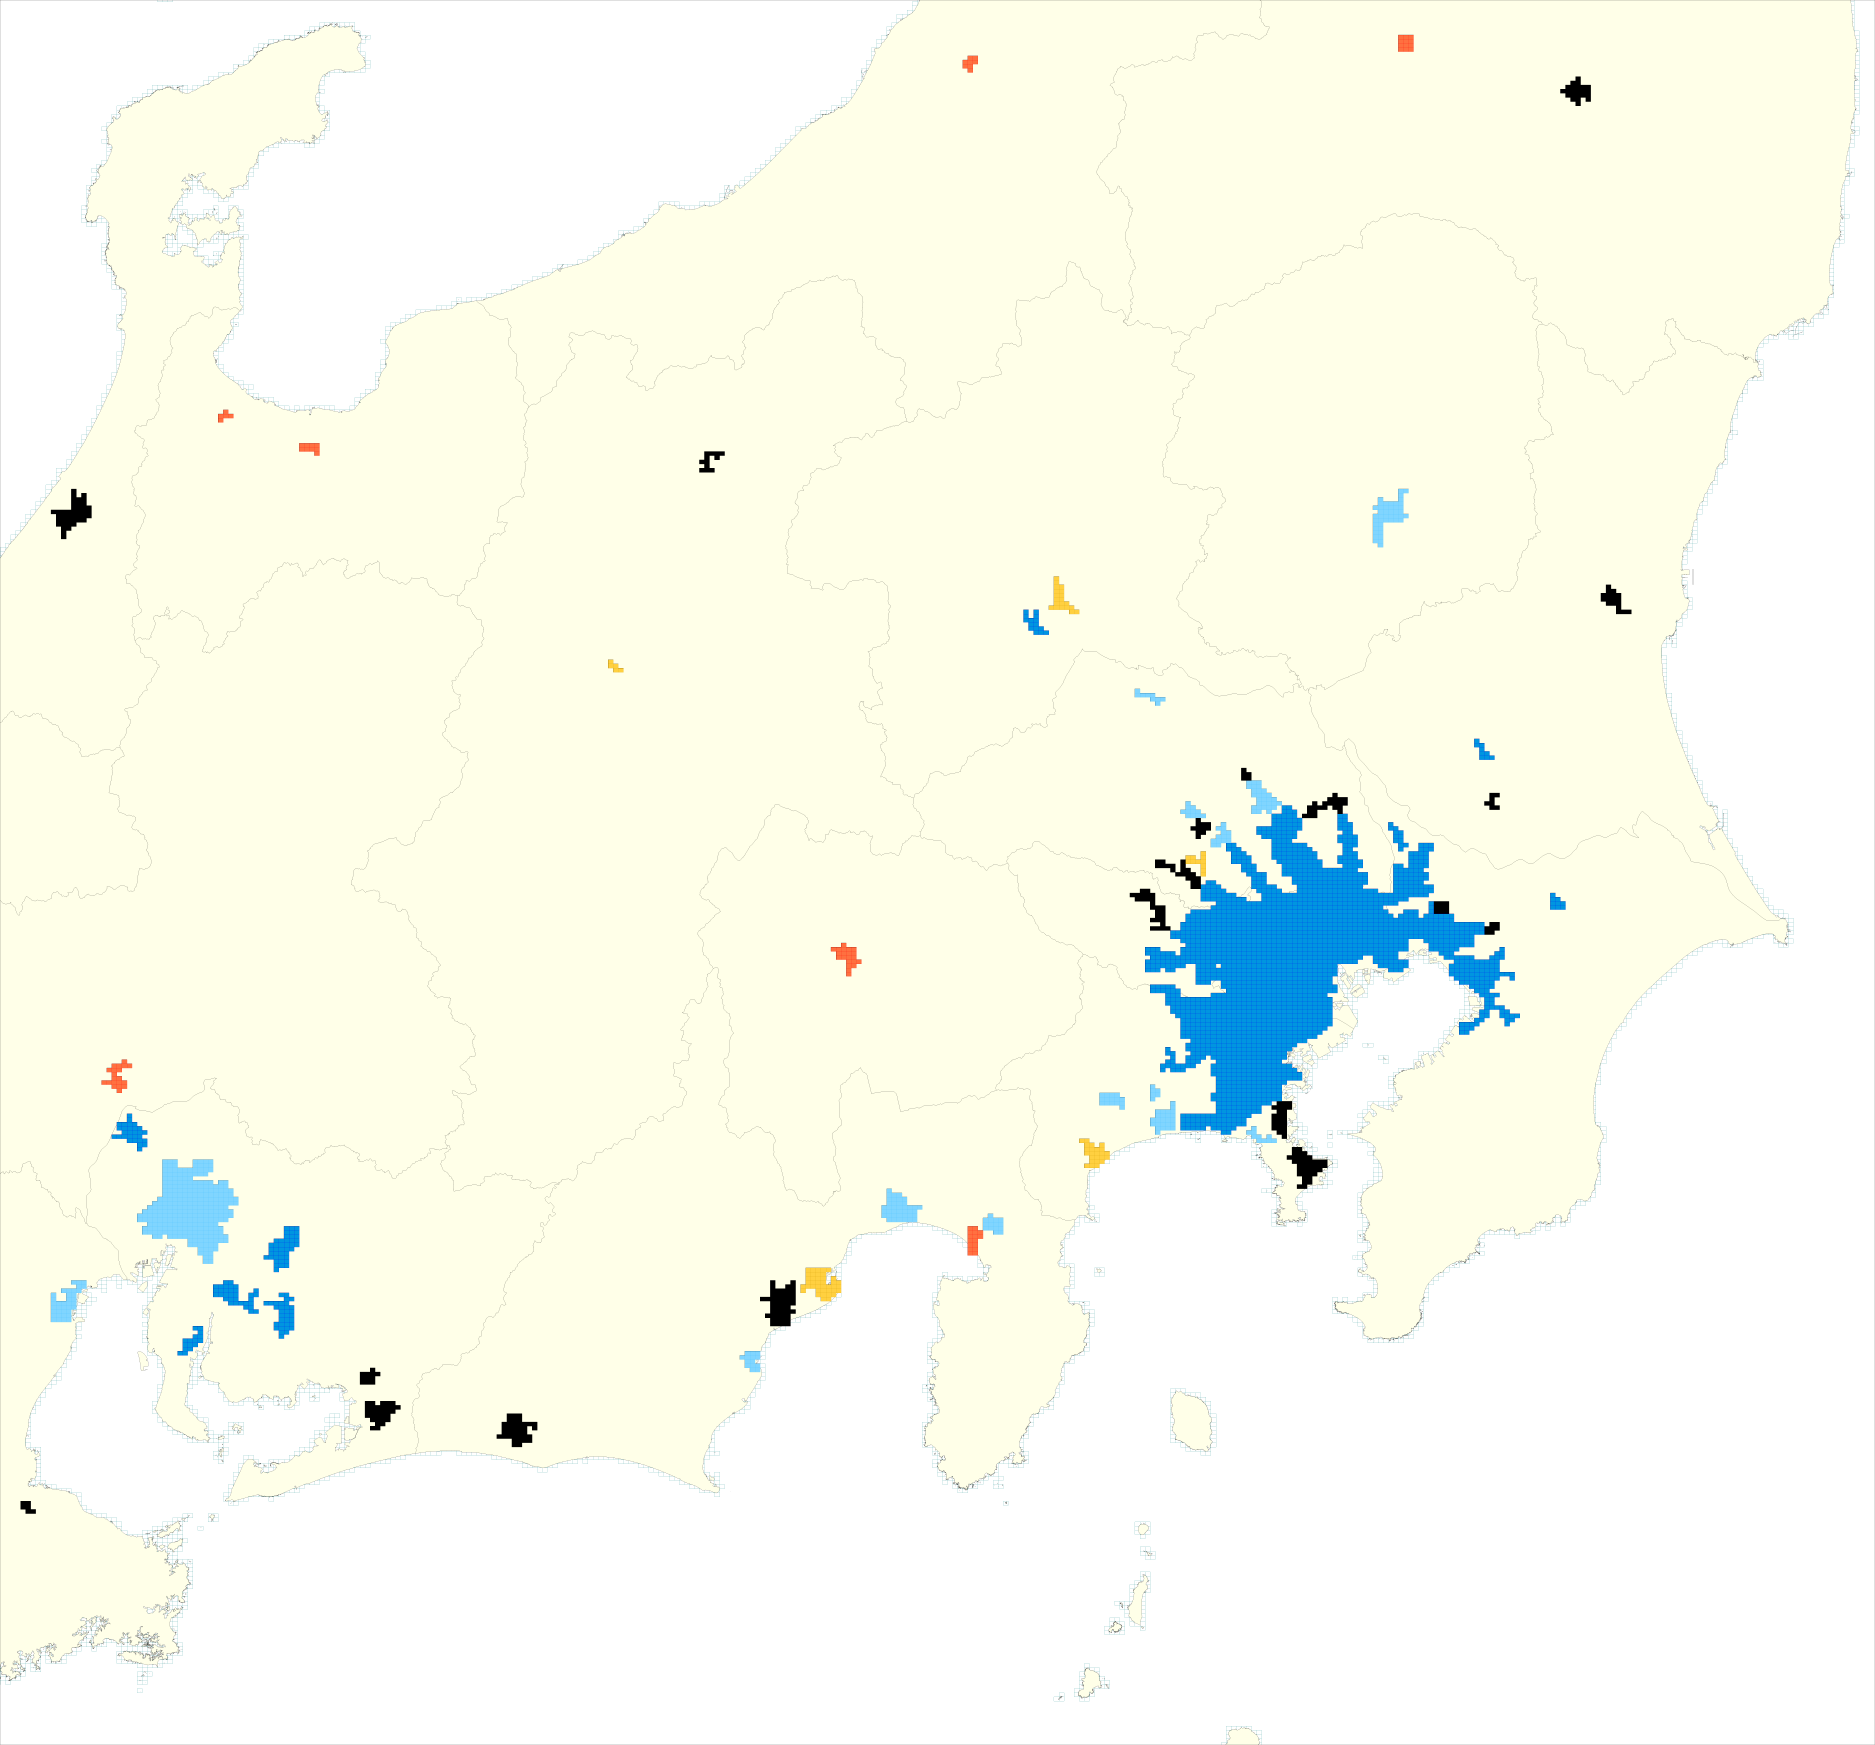 In the Hokuriku Shin-etu area, populations fluctuated at Niigata, Nagano,
and Kanazawa, whereas other centers experienced consistent decreases.
In the Hokuriku Shin-etu area, populations fluctuated at Niigata, Nagano,
and Kanazawa, whereas other centers experienced consistent decreases.
In the northern part of the Kanto area, the only
cities where populations consistently declined were Maebashi, Sayama, and
Odawara. In the Tokai area, Kofu, Numazu, Shimizu, and Gifu were the only
cities where population numbers consistently declined. Particularly notable are
higher rates of increases experienced in the cities around Toyota vs. those
near Nagoya.
 In Kansai, Wakayama experienced consistent declines in population, whereas
Osaka/Kobe and Kyoto showed consistent, albeit slight increases. On this
basis, the population increases at Otsu and Kusatsu are conspicuous.
In Kansai, Wakayama experienced consistent declines in population, whereas
Osaka/Kobe and Kyoto showed consistent, albeit slight increases. On this
basis, the population increases at Otsu and Kusatsu are conspicuous.
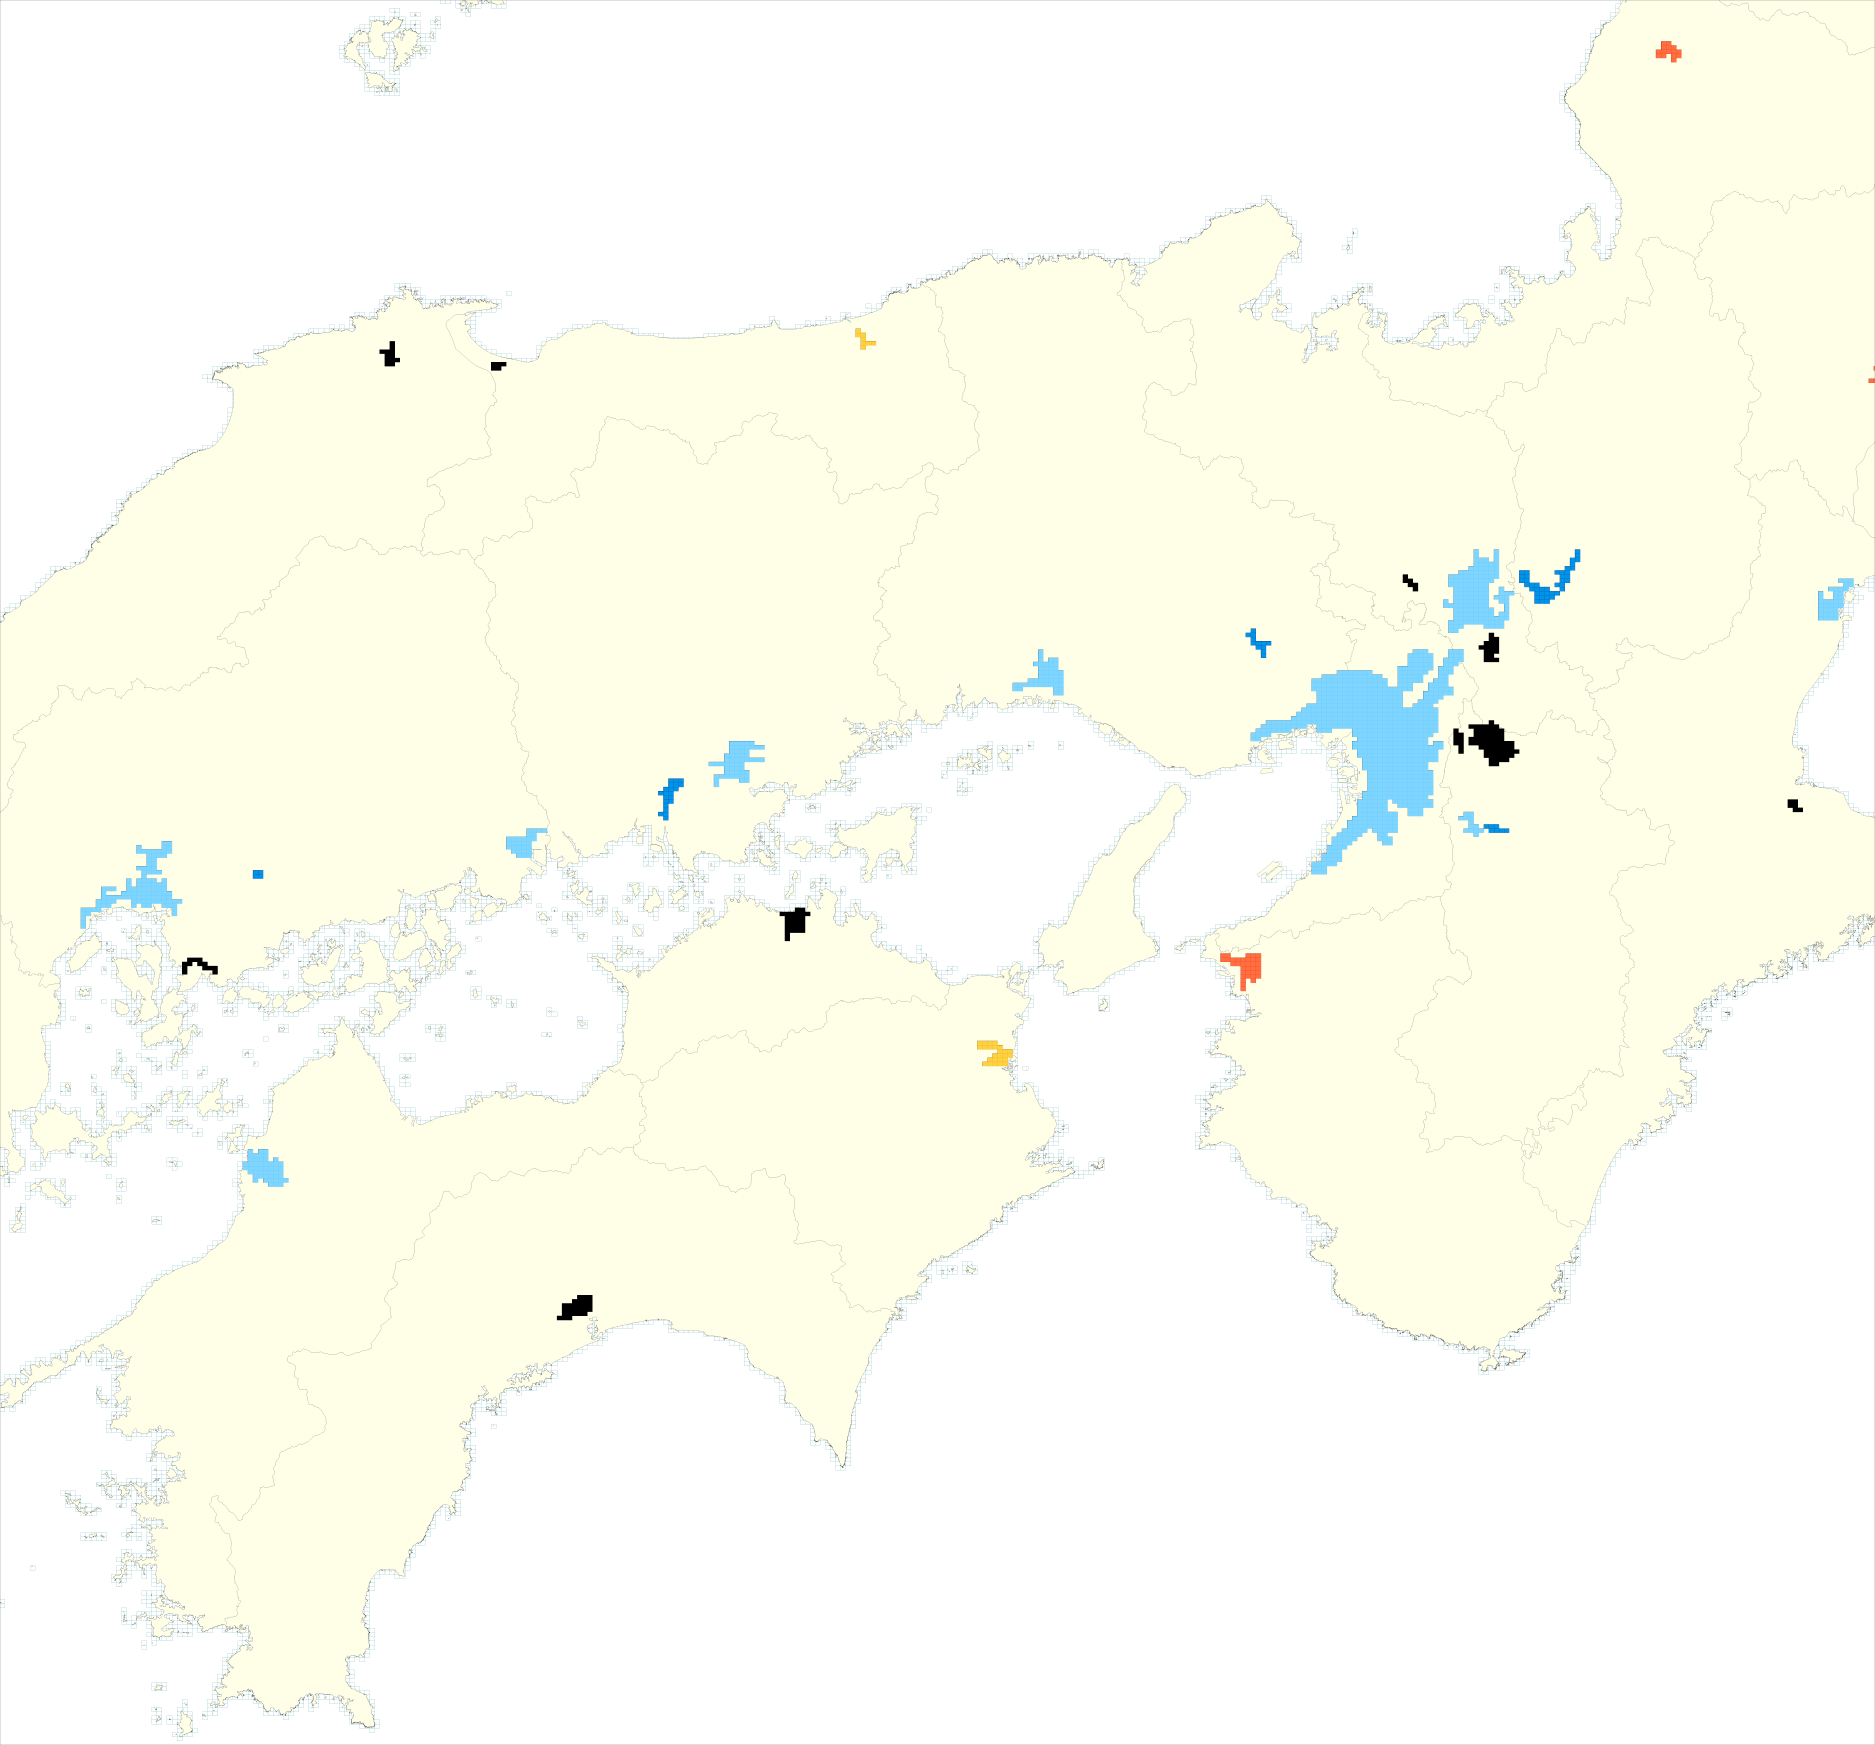
In Chugoku, in the Seto Inland area around the
Pacific coastal belts, only Shimonoseki and Shunan demonstrated consistent
decreases in population, and on the Pacific side only Tottori experienced
consistent decreases in population.
In Shikoku, Matsuyama experienced an increasing
population whereas Tokushima was of the consistently decreasing type. Takamatsu and Kochi show evidence of fluctuating populations.
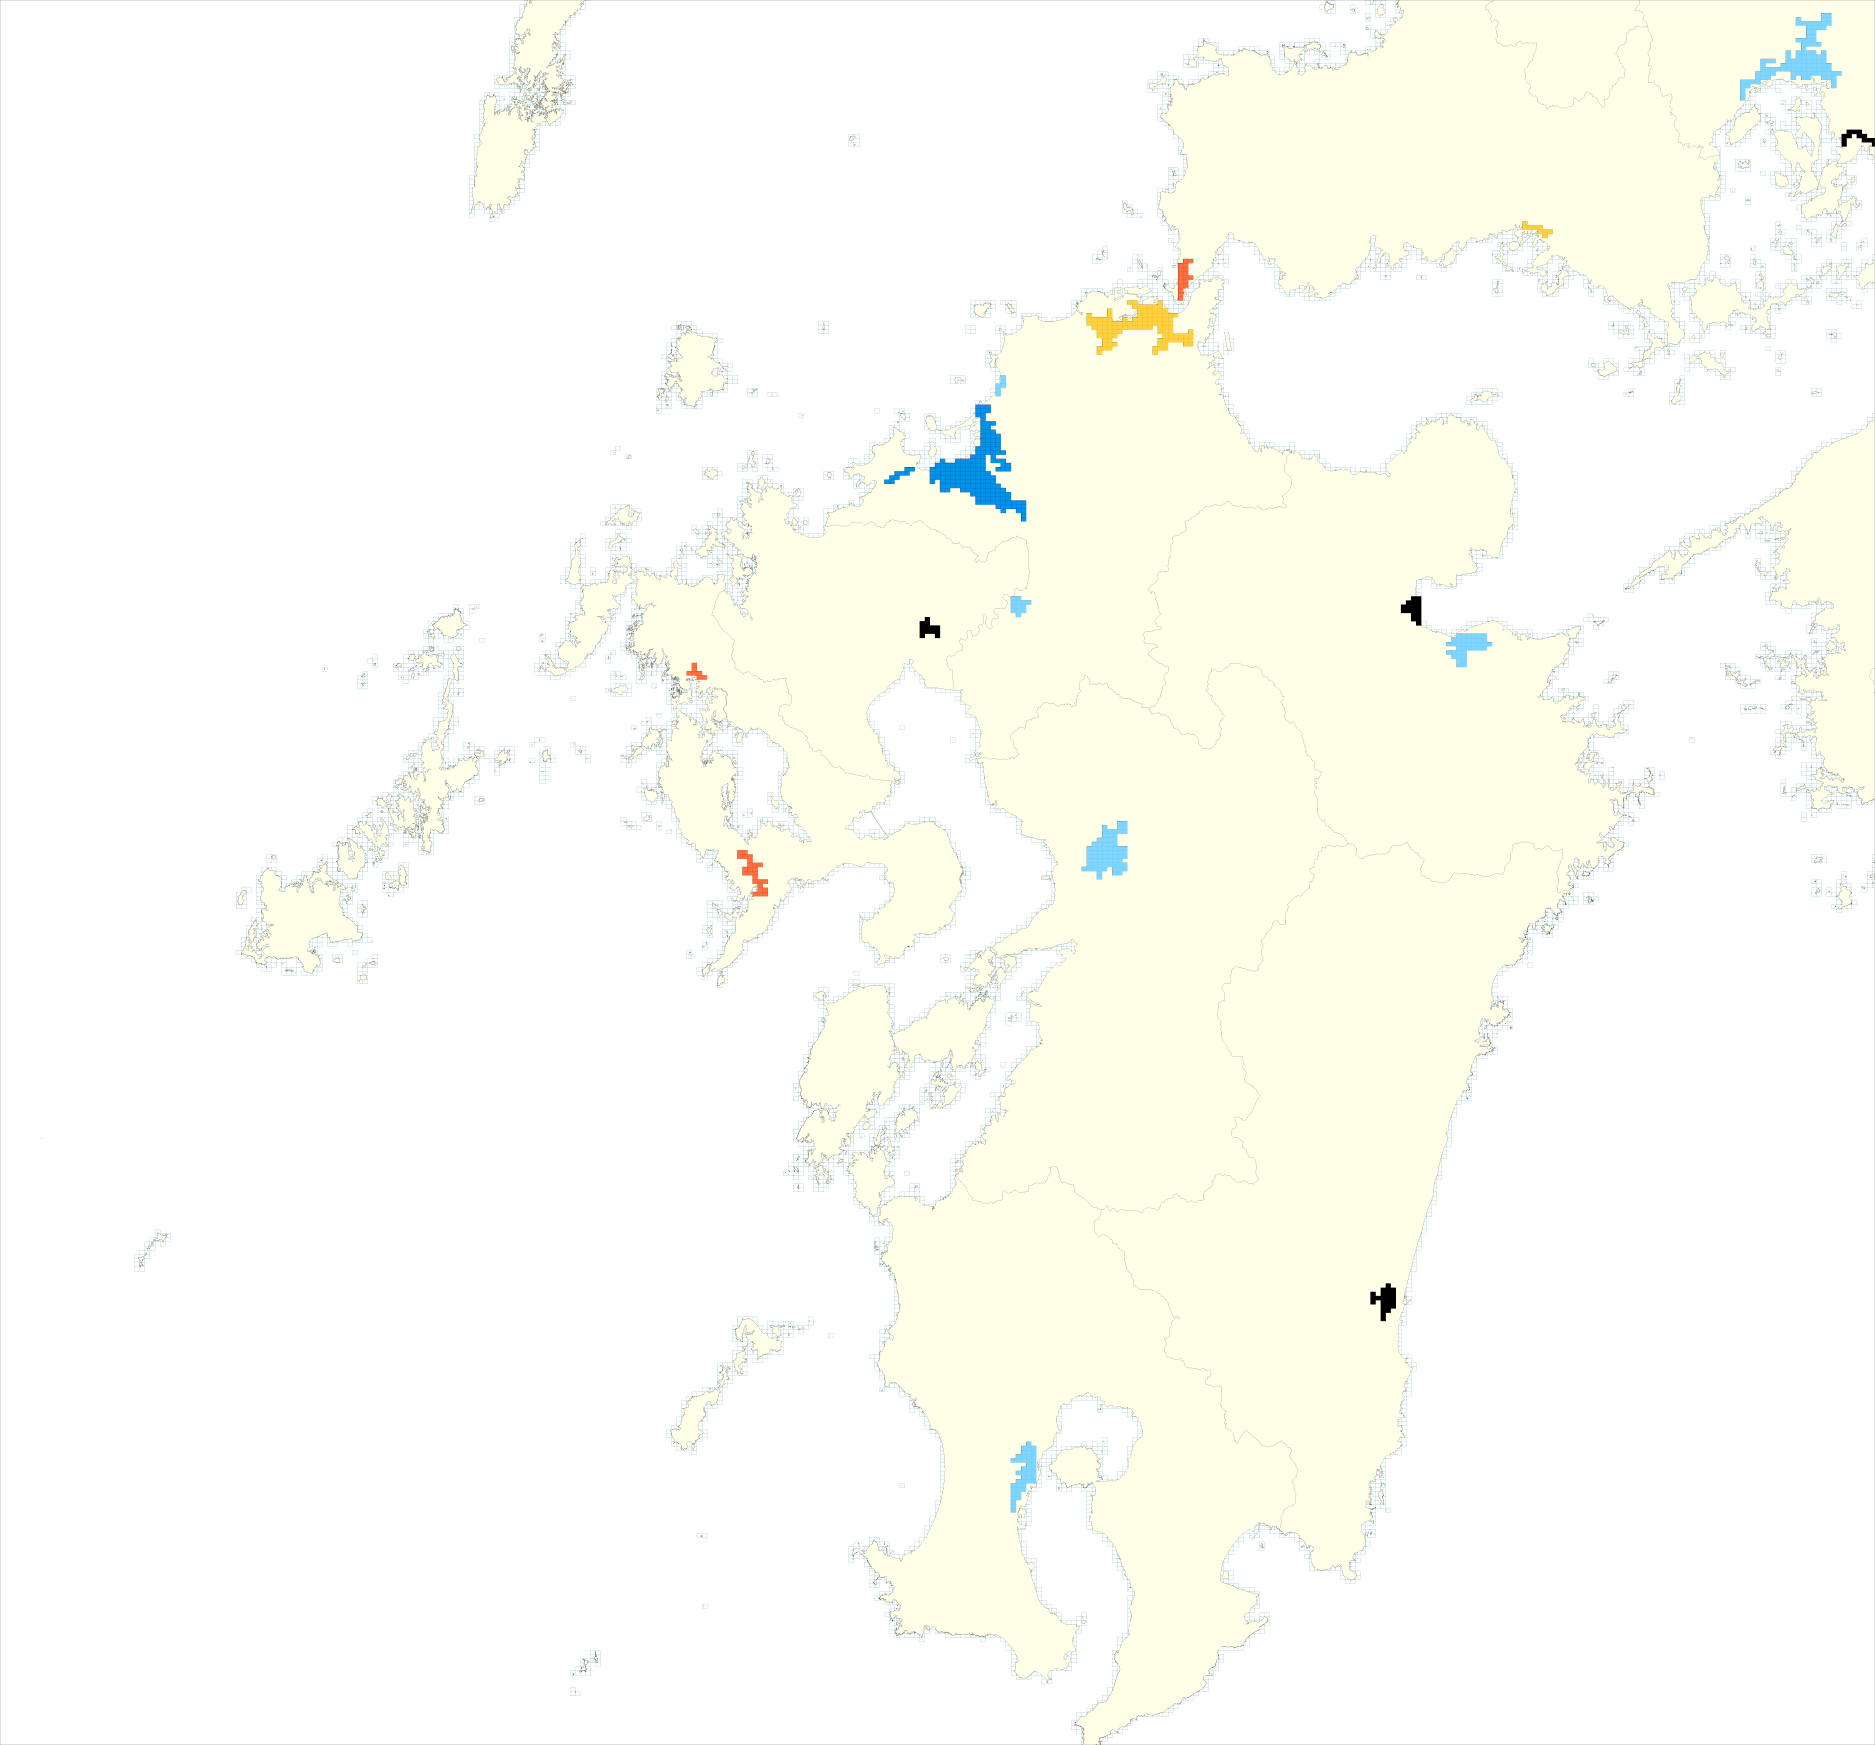
In Kyushu, the populations of Fukuoka, Kurume,
Oita, Kumamoto, and Kagoshima consistently increased, whereas the populations
of Sasebo, Nagasaki, and Kitakyushu exhibited a contrasting pattern and
populations of Saga, Beppu, and Miyazaki saw fluctuations.
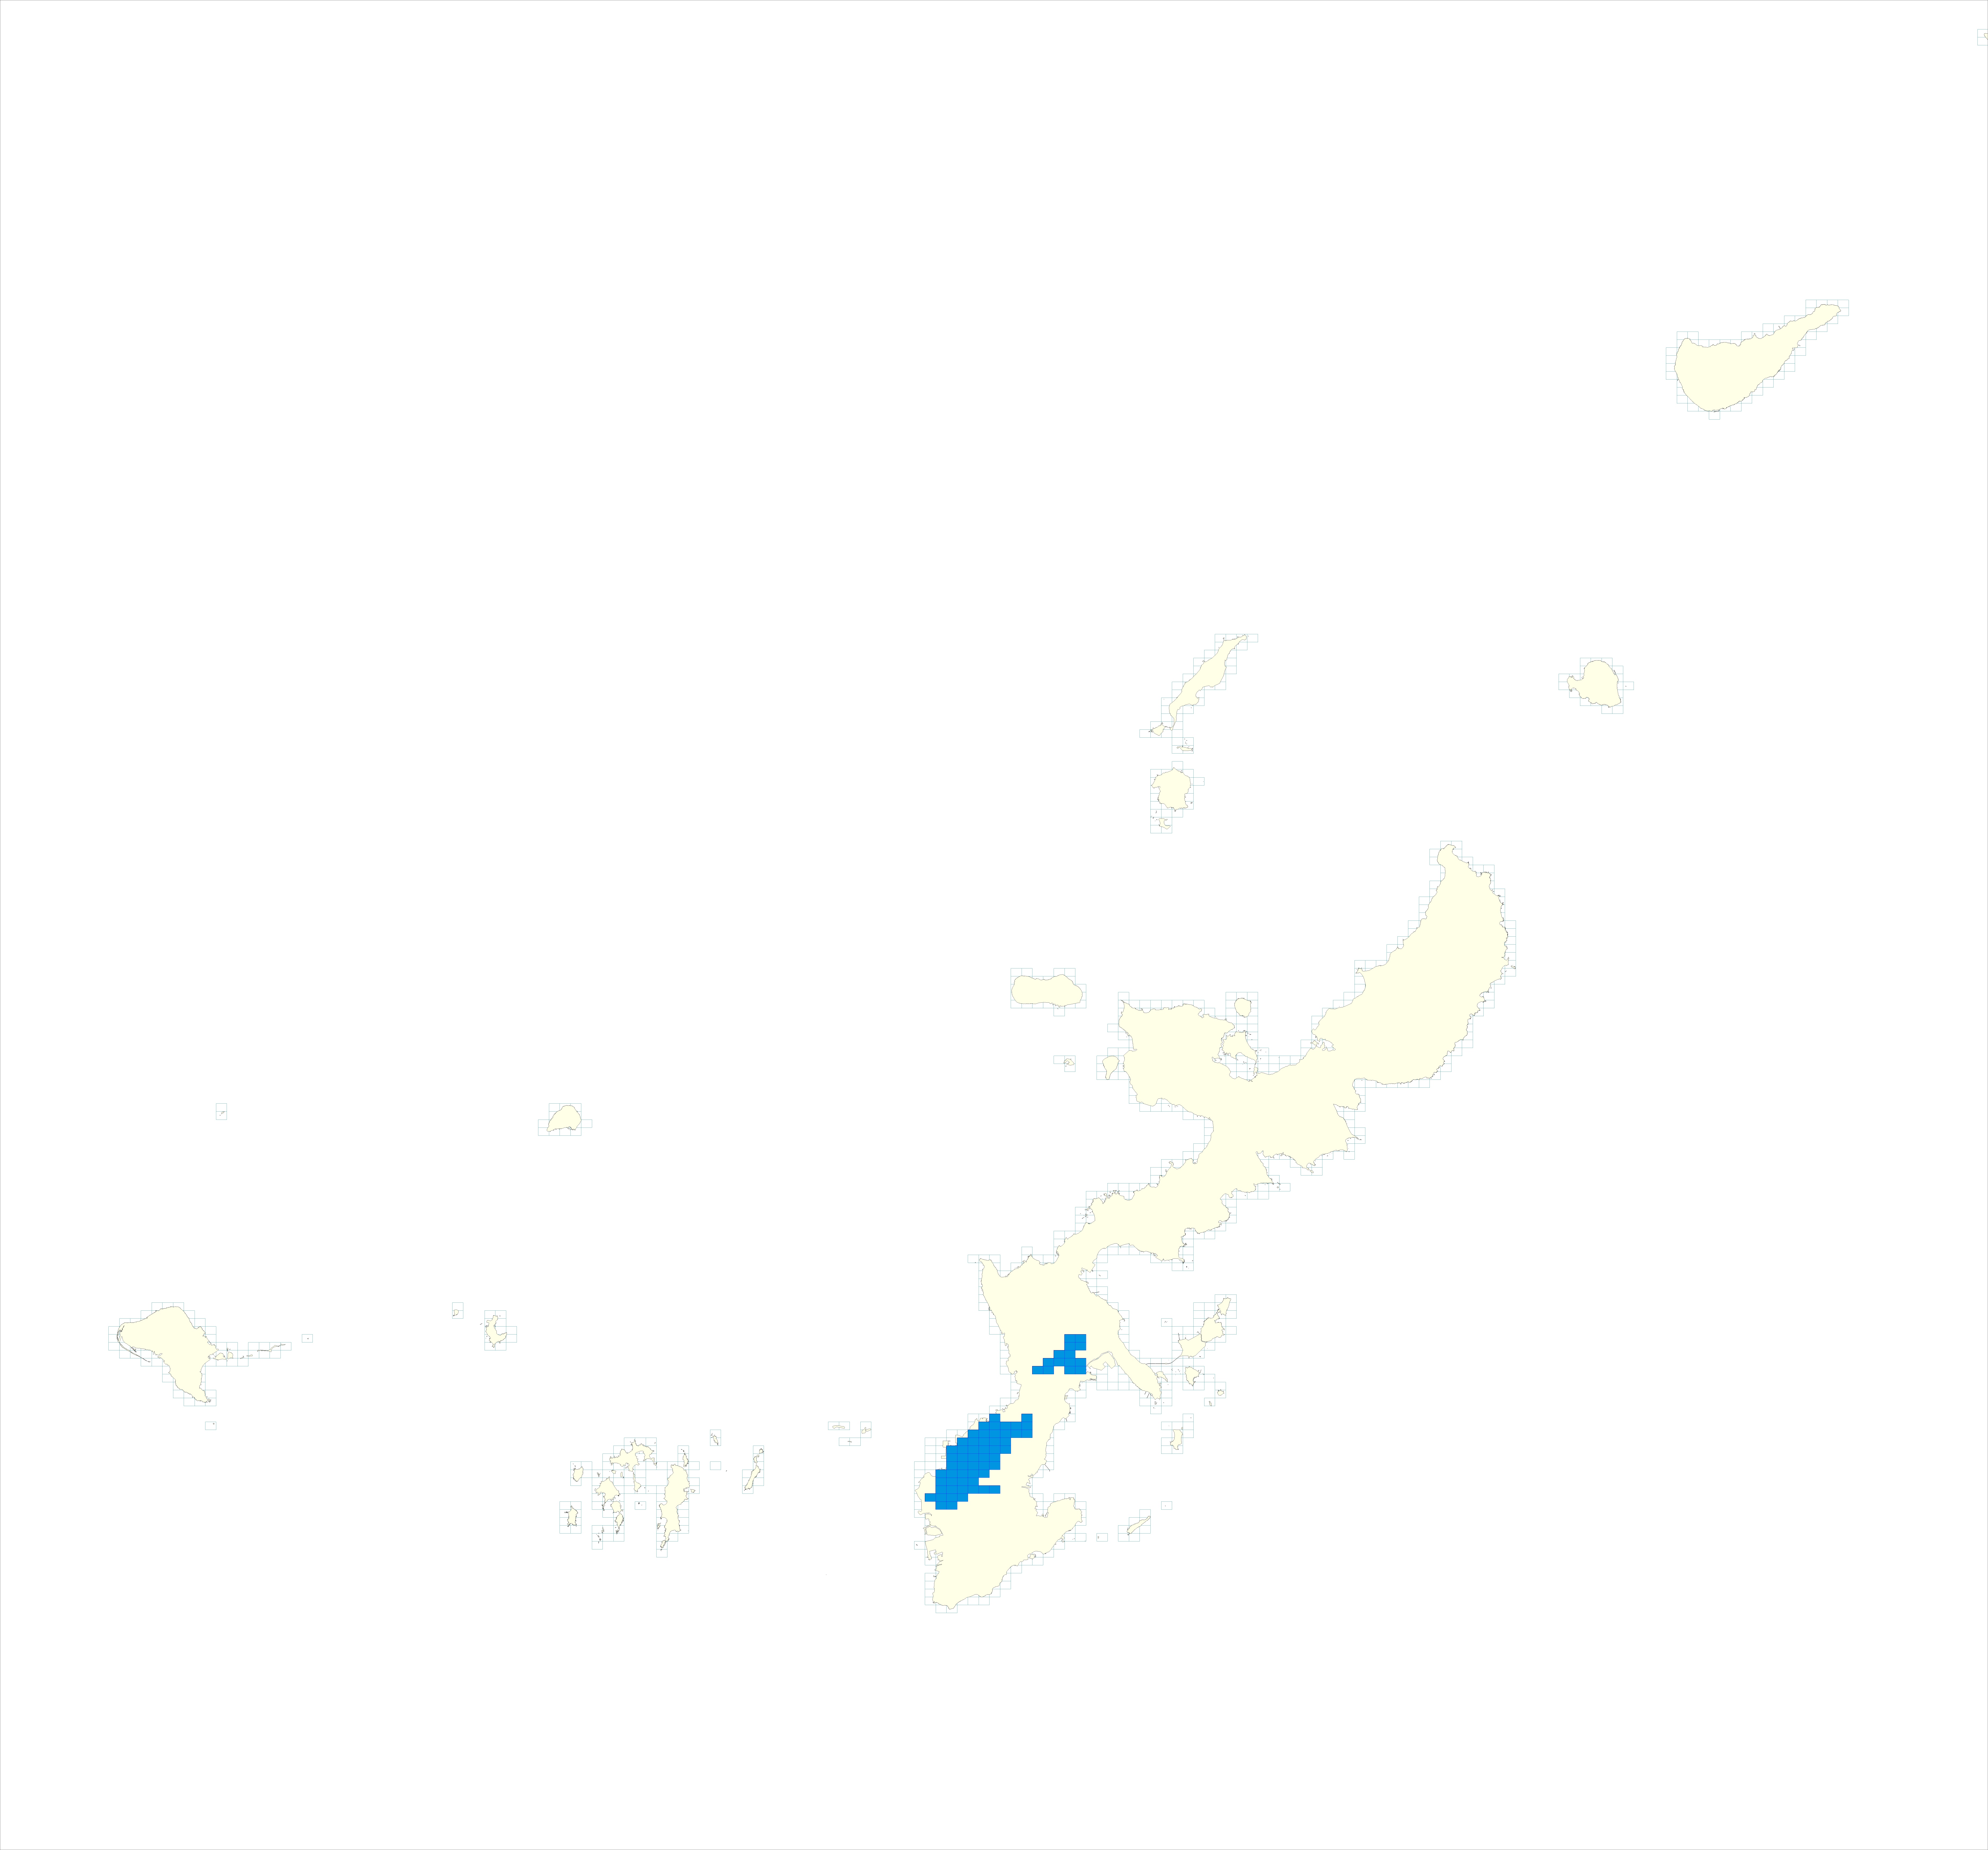
Finally, in Okinawa, both Okinawa and Naha experienced consistent increases
in population.
| Assessing Dual Dimensions of Population Change |
From the above trend analysis, which characteristics describe the changes in population of cities across Japan?
Firstly, considering the country as a whole, many cities in the Pacific coastal belt zone have expanded their populations relatively steadily, whereas populations continue to decrease in Tohoku and Hokkaido on the Japan Sea side.
Additionally, in comparison with most other metropolitan areas, Tokyo experienced higher rates of a consistently increasing population, whereas Osaka/Kobe and Nagoya showed slightly lower rates of growth. In this sense, Fukuoka exhibited the same rate of increase as Tokyo.
Next, what kinds of features can be seen in each region?
In Hokkaido, the population concentration of Sapporo presents a remarkable
contrast with the decreasing populations of other cities.
The case of Tohoku is similar to that of Hokkaido in that, except for Fukushima
and Koriyama which are relatively close to Tokyo, most cities have consistently
declined in population, although fluctuations have occurred at Sendai and
Morioka. Because this analysis ends at 2010, the situation since 3/11,
aka the Great East Japan Earthquake of 2011, is not reflected here.
In Chubu and Hokuriku Shin-etsu area, most cities, including Kofu and Gifu, experienced consistently decreasing populations, and only Nagano, Kanazawa, and Niigata escaped this trend. Similar circumstances characterized the Sea of Japan side of Chugoku District.
Many cities in the Pacific Coastal Belt zone avoided decline, and in the
case of Kanto, most cities, particularly Tokyo, experienced consistent
increases in population.
In the Tokai region, consistent declines in population only occurred in
a few cities, whereas the situation remained good in Toyota, Anjo/Kariya/Chiryu,
Okazaki, and Handa, showing an increased rate of growth over that of Nagoya.
The presence of TOYOTA, a global automobile company, might have a great
influence on population in this area.
Other than Wakayama, no cities show consistent decreases in population,
and it is particularly notable that the cities of Otsu and Kusatsu near
the Nagoya area increased their populations at a greater rate than did
those of Osaka/Kobe and Kyoto. Except for Shimonoseki and Shunan on the
Seto Inland Sea side, no cities in the Chugoku area showed consistent declines
in population.
In Shikoku, each of the four prefectures has one
city and each maintains a moderate distance from one other. However, Tokushima,
which is close to the Kansai region, experienced consistent decreases in
population, whereas in contrast, Matsuyama’s population consistently increased.
In Kyushu, moderate populations were maintained in Kumamoto, Oita, Beppu,
Miyazaki, and Kagoshima, which are far from Fukuoka. Similar to Sapporo
in Hokkaido, Fukuoka experienced a high rate of consistent population growth,
whereas Kitakyushu, Nagasaki, and Sasebo, which are relatively close to
Fukuoka, exhibited population declines, and only Kurume showed an increasing
population.
The final thing to note is that in Okinawa Prefecture, Okinawa and Naha cities experienced consistent population growth at rates that exceeded the national average.
Based on those results, the following findings can be declared:
1. Population agglomerations were seen in the
Pacific Coastal Belt and in the major metropolitan areas of Tokyo.
2. Populations are concentrated in major cities in
the Hokkaido, Tohoku, Kyushu, and other regions.
3. In Kyushu and Shikoku, several cities have maintained moderate distances
from each other. These areas have maintained their populations without
evidencing significant increases or decreases.
4. The two opposing trends of decreasing and increasing population are seen in smaller cities close to major centers.
In short, patterns of population concentration are visible at dual scales, namely at the national and regional levels.
| What the findings suggest |
The above findings seem to provide a well-grounded argument for establishing local core cities that centralize population by region, which supports the Ministry of Land, Infrastructure, Transport, and Tourism: MLIT’s plan of “Grand Design of Spatial Development towards 2050, Japan”, which features “compact + network” as a core concept. However, at the same time, population tends to concentrate in major cities at several levels, and it is very doubtful whether the population of each city can be maintained if the networks between them are tightened. As suggested by the dual dimension assessment, the idea of a “super-mega-region” that connects the three major metropolitan areas might end up with this proposed super-mega-region only accelerating and exacerbating the concentration in Tokyo at the expense of other cities. Rather, it is necessary for cities to maintain moderate distances from each other and control the networks. It is not always possible to generate the growth of a well-balanced city solely by making improvements in high-speed transportation network. .
![]()
ConTAct us AT
Prof. Kazushi Tamano
2-11 Wakaba Mihama-ku
Chiba-City, Chiba, Japan 261-8586
(The Open University of Japan)
tamano@k.email.ne.jp