PROJECT III
Transition of Expanded Cities Across Japan
| Date Analysis |
Our former project from 2016 to 2018 provided significant insights regarding the population change based on mdbUA2010, by analyzing the long-term data trend based on the Tokyo Datum from 1970 to 2005. The population change in 118 urban areas in Japan during that period has been classified into five patterns.
1. Expanded Cities (cities with a steadily increasing population)
2. Sustainable/Stable Cities (cities with a relatively stable/sustainable population)
3. Converted Stagnant Cities (cities shifting to stagnant population growth after a certain point)
4. Converted Contracting Cities (cities shifting to population decline after a certain point)
5. Contracting Cities (cities with a steadily decreasing population)
Please refer here for more details.
In comparison, the data based on the World Geodetic System (WGS) only cover the period from 1995 onward, including the more recent data for 2015 and 2020 that the Tokyo Datum does not cover. We analyze the WGS-based data for 1995–2020 and compare them to the above five patterns derived from the Tokyo Datum-based analysis, addressing how those patterns of population transition have altered over time.
Please refer here for the difference between the WGS-based and the Tokyo Datum
| 1.Transition of Expanded Cities |
The long-term trend analysis using the Tokyo Datum-based data clarifies that the population of 46 urban areas steadily grew from 1970 to 2005. According to WGS-based data in those same areas for 1995–2020, which means adding the 2015 and 2020 data to the short-term data set for 1995–2010 our former project used, 24 of them show their constantly increasing population during the term, while the other 22 show little growth, if any.
Of the Sustainable/Stable Cities formerly classified by the Tokyo Datum-based data analysis, the WGS-based data indicates that five cities experienced a shift in population growth from 1995 to 2020. In sum, 29 urban areas are classified as Expanded Cities, as revealed by our latest analysis. This finding also suggests that the number of applicable cities has reduced almost by half since 2005, when Japan’s national population began to decline.
We now consider what sort of cities have and have not maintained their population growth.
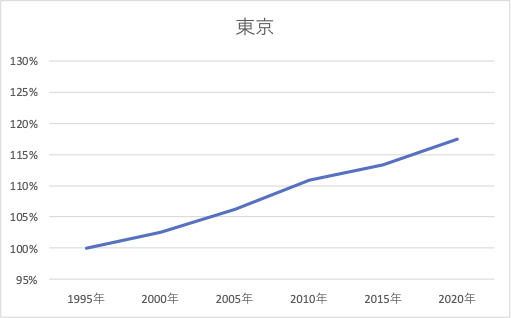
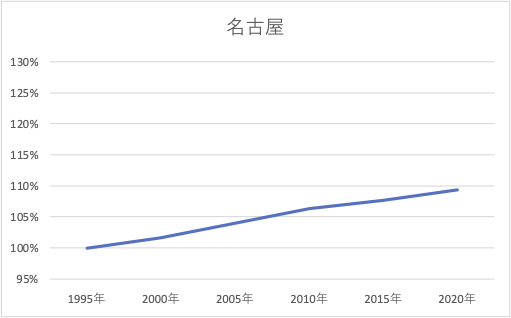
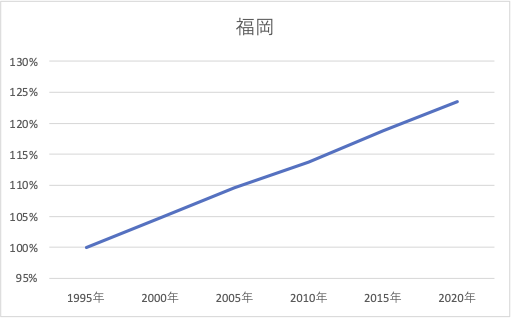
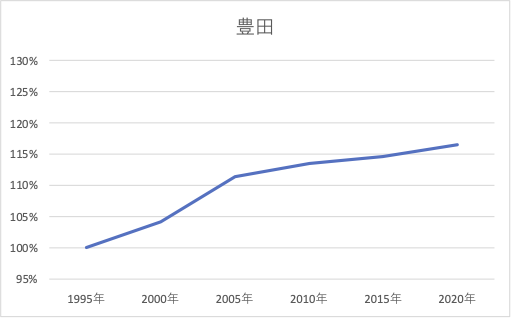
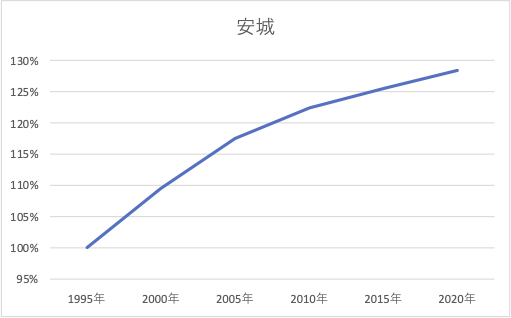
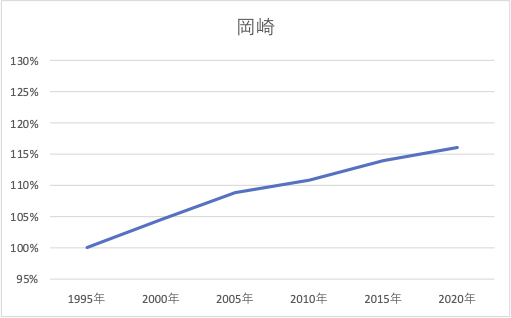
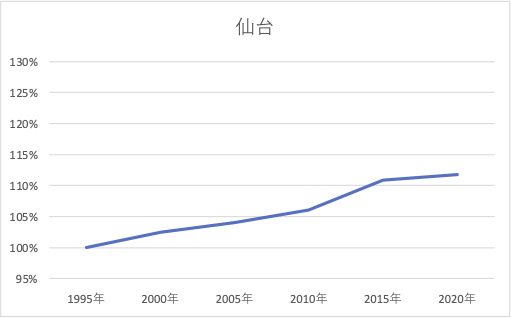
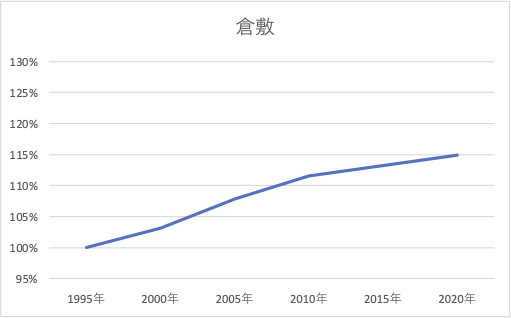
The cities that meet the former condition are categorized into three types. The first type is metropolitan areas such as Sapporo, Tokyo東京, Nagoya名古屋, and Fukuoka福岡. The second type is urban areas associated with the TOYOTA Corporation, such as Toyota豊田, Anjo安城, and Okazaki岡崎. The third type includes some regional core cities, such as Sendai仙台, Okayama, Kurashiki倉敷, Hiroshima広島, and Matsuyama.
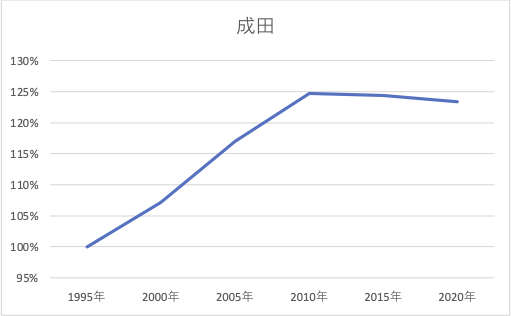
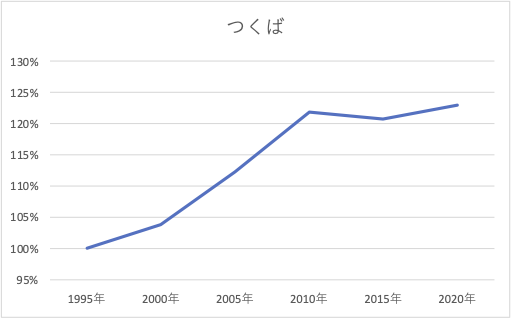
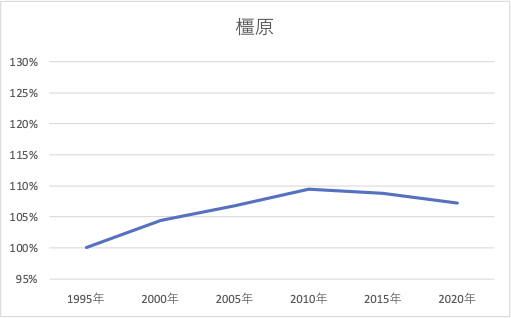
The cities with the latter condition, whose population has stagnated or
begin to shrink, exhibit a clear tendency. These are the urban areas neighboring
the metropolitan areas in the Kanto and Kansai regions: Narita成田, Ushiku,
Tsukubaつくば, Fukaya, Iruma, Ome, Atsugi, Hadano, and Hiratsuka in Kanto;
Kashihara橿原, YamatoTakada, and Sanda in Kansai.
![]()
ConTAct us AT
Prof. Kazushi Tamano
2-11 Wakaba Mihama-ku
Chiba-City, Chiba, Japan 261-8586
(The Open University of Japan)
tamano@k.email.ne.jp