Tenured Professor at
The Open University of Japan
PROJECT I
Findings Using mdbUA
| Has Osaka Declined in Strength? |


population change of Osaka Prefecture population change of Kobe City
polulation change of the sum total
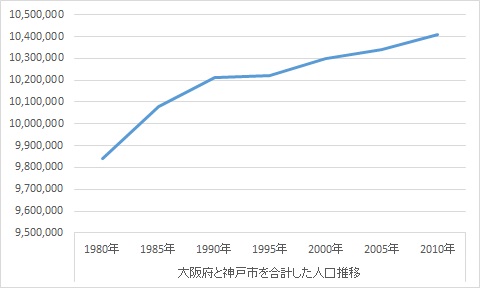
In contrast, by tracking back the meshed data of the urban areas defined
here at our lab using mdbUA2010, we have clearly captured the population
decline in 1985-1995 when the existing statistical report using the official
administrative units, namely, Osaka prefecture and Kobe-city failed to
do so.

population change of mdbUA2010: Osaka=Kobe


As demonstrated above, the efficacy of the demarcation of urban areas by mdbUA is clear.
| Our Analysis Using Economic Census |
Our analysis, in the same manner, instead of the national census, using the Economic Census that encompasses the number of enterprises/establishments and employees is as introduced below.
In Japan, analysis using the Economic Census is also common, besides that which used the national census. This dataset helps us confirm the dynamics of the number of enterprises/establishments and employees in urban areas during the given period. Thus the developments and declines of industrial compositions can be clarified. This elucidates what sectors constitute the region’s industry and what sectors were withdrawn from the frontline.
Introduced here are the findings on the vicissitudes of industries and
their significance in the three largest urban areas in Japan.
| The Rise and Fall of the Manufacturing Industry |
In the three largest urban areas, the decline of the manufacturing industry is salient. During 1986-2006, the number of manufacturing businesses and employees reduced almost by half in every urban area. Although Sassen’s report on Tokyo in the 1980’s revealed Tokyo’s manufacturing industry experienced relatively minor decreases in comparisons with that of New York and London, it seems Tokyo also subsequently underwent the same rapid decline of manufacturing sector.
However, in Chukyo-region, which is home for TOYOTA , the decline of manufacturers
was limited. It was especially so in Toyota , Anjo-Kariya-Chiryu and Okazaki.
Plus the growth of the service sector is evident in those areas. It shows
that the limitation of the manufacturing industry decline allowed the following
growth of the service sector in the region.
| Tokyo’s Development Remained High with ICT Industry |
Despite the rapid decline of the manufacturing industry, Tokyo maintained its high growth, owing to the service sector’s development. The growth of the service sector was not so much accounted for by the expansions of producer services (such as business consultants, finance and legal business or accounting business) catering to global enterprises but the growth was because of the ICT sector’s development.
| Osaka’s Difficulties |
The ICT industry does not need the geographic dispersal of its bases. Instead concentration serves better for its growth. This nature of ICT businesses lead to excess concentration in Tokyo and also explaine the decline in Osaka. Among the three largest urban areas, Osaka is said to face the most drastic decline of growth. Currently the only growth observed in Osaka is the service industry of medicine/welfare.
| The Significance of mdbUA2010 Based Analysis |
The significance of time-series analysis based on mdbUA2010 is evident as explained above. In order to further advance analysis and its promotion, for those who agree to share the knowledge, we are willing to send the mdbUA dataset. Please feel free to contact us via email.
ConTAct us AT
Prof. Kazushi Tamano
2-11 Wakaba Mihama-ku
Chiba-City, Chiba, Japan 261-8586
(The Open University of Japan)
tamano@k.email.ne.jp