Tenured Professor at
The Open University of Japan
PROJECT I
How We Defined Urban Areas
| Using Grid square Statistical Data |
As already stated, the scaling of local grids are comprised of 5 layers; the 1st, 2nd, 3rd unit, half-square and quarter-square unit. The 3rd unit is the standard size and measures 1 square kilometer.
| How Many People Per Area should be Our Standard? |
National census geographical information linked to standard grid squares of 1km is our basies of defining urban areas. Here, we will demonstrate the Tokyo region’s case for example.
- The grid squared map with 5 levels of population size is developed.
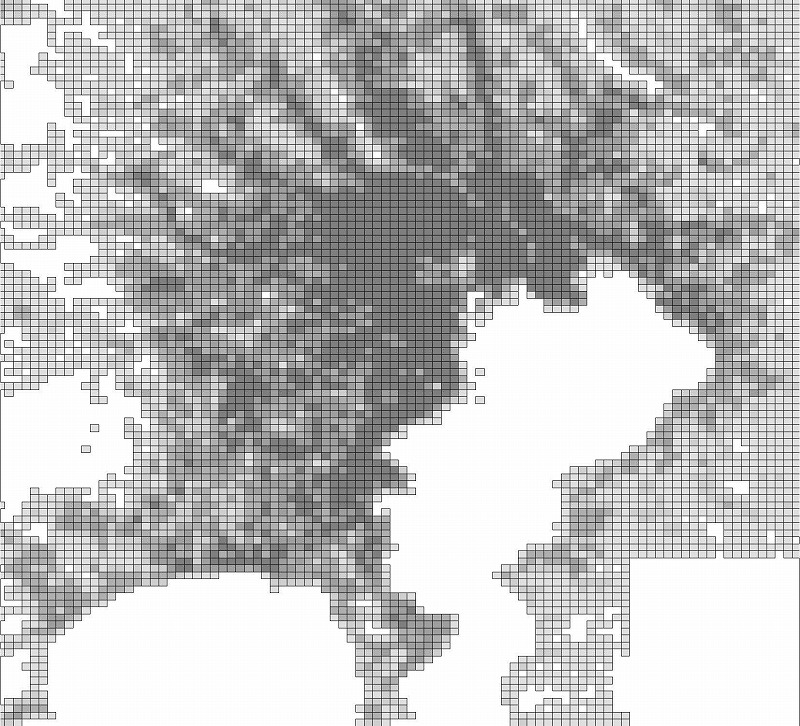
- The result will be the gradation of density, with the most populated area in the center gradually fading to the outskirts
- With several population sizes Tokyo’s urban areas were drawn. As demonstrated in the chart below, demarcation by squares of 6,000 people is able to distinguish suburban cities, such as Hachioji and Machida. With 5,000, the map does not capture these distinctions having them all recognized as one continued region.
with 6,000 people with 5,000 people
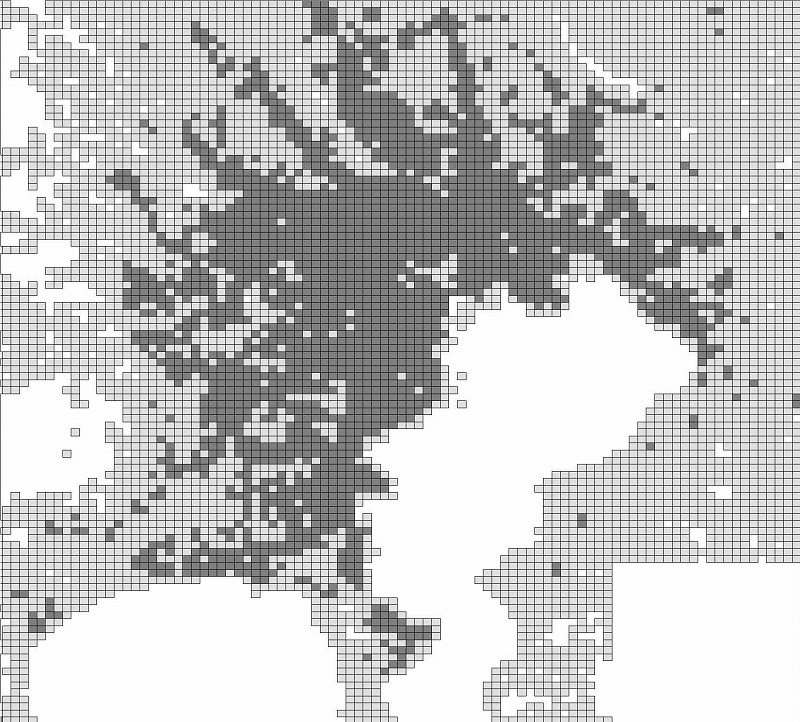
- When applied for urban areas other than Kanto region, the inadequacy of mapping with 6,000 people is that too many areas will not be picked up as urban areas. Hence the 5,000 has been adapted. As it is expected to display something similar to the existing scaling of DID with 4,000 people, 5,000 scale also allows continuity to DID.
| Our Standard, 5,000 People per 1 Square Kilometer. |
Hence 5,000 people/km2 has been set as our standard scale. Next, more details of the method will be explained.
- First, the distinction of grid squares of 5,000 and more and those with less than 5,000 will be made by coloring.
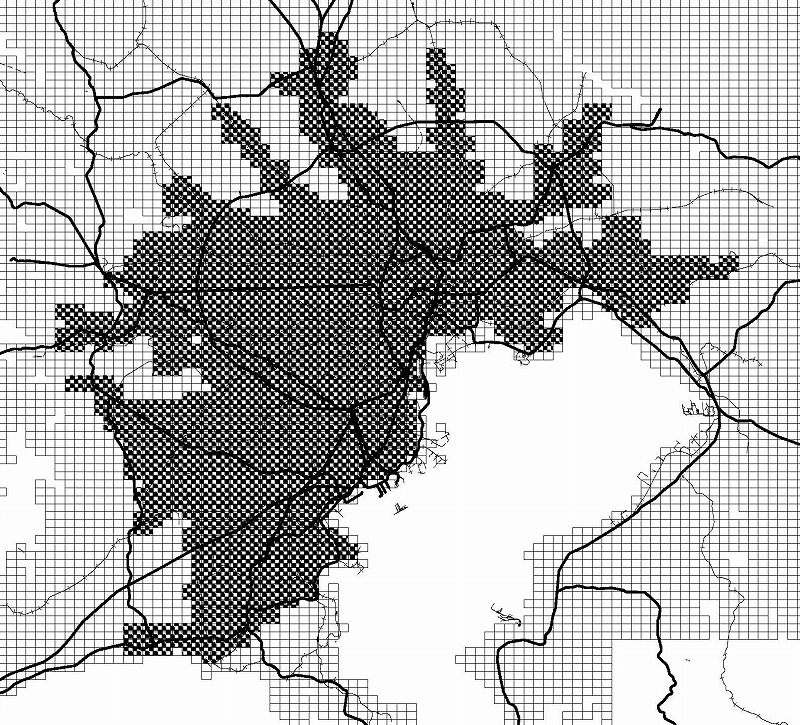
- As shown in the chart, Tokyo’s dense areas are sprawled reflecting the shape of public transport train systems. The question here is where to draw the line marking the tail ends of them.
| Where Should be Considered as the End? |
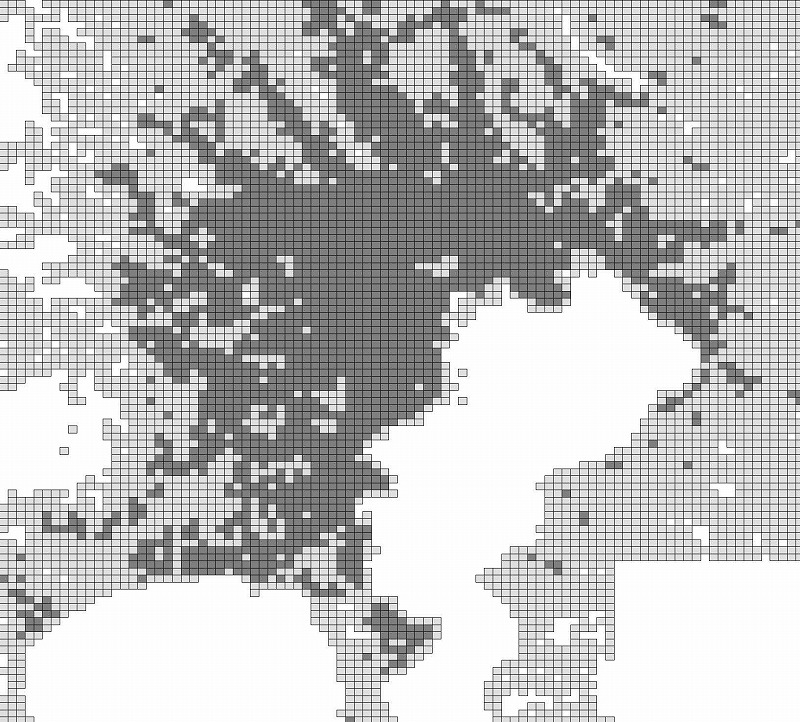
The Case of Metropolitan Area
In peripheral areas, 5,000 people grid squares are often times adjacent to other squares by only one side or even by a single corner resulting the long stretched strips along the train system lines. In order to avoid such shapes, here we will cut off those grid squares connected to another by only one side or a single corner.
The above cut-off rule will be adapted to the following 3 metropolitan regions; Kanto, Chukyo, Kansai.
See the Tokyo’s case for an example.
The Case of Other Cities
However, the same cut-off rule should not be applied to other cities as areas that should be considered one continuity would be minced into pieces. The method of cut-off for other cities will be explained next.
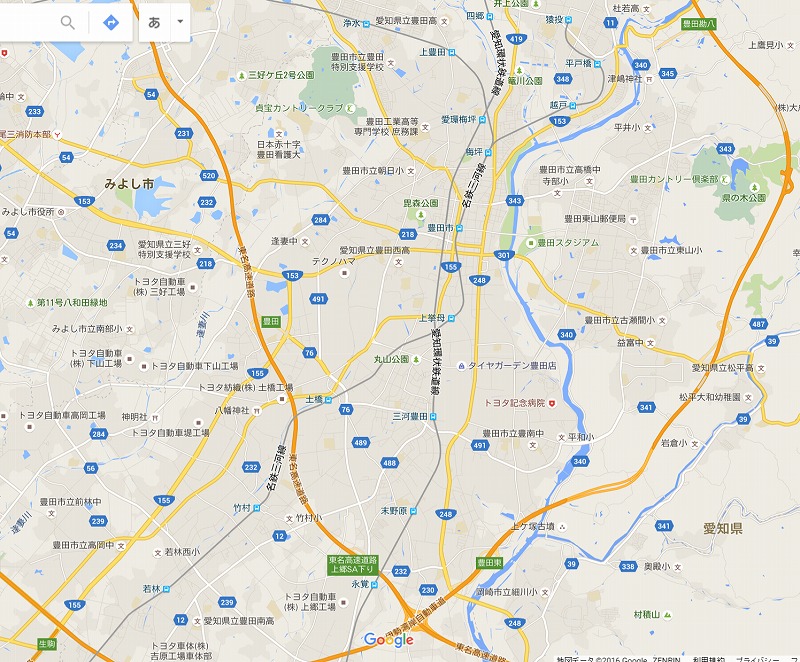
(For an example, let us take a look at Toyota-city that has TOYOTA Corp. Its grid square map of more than 5,000 people is presented below.)
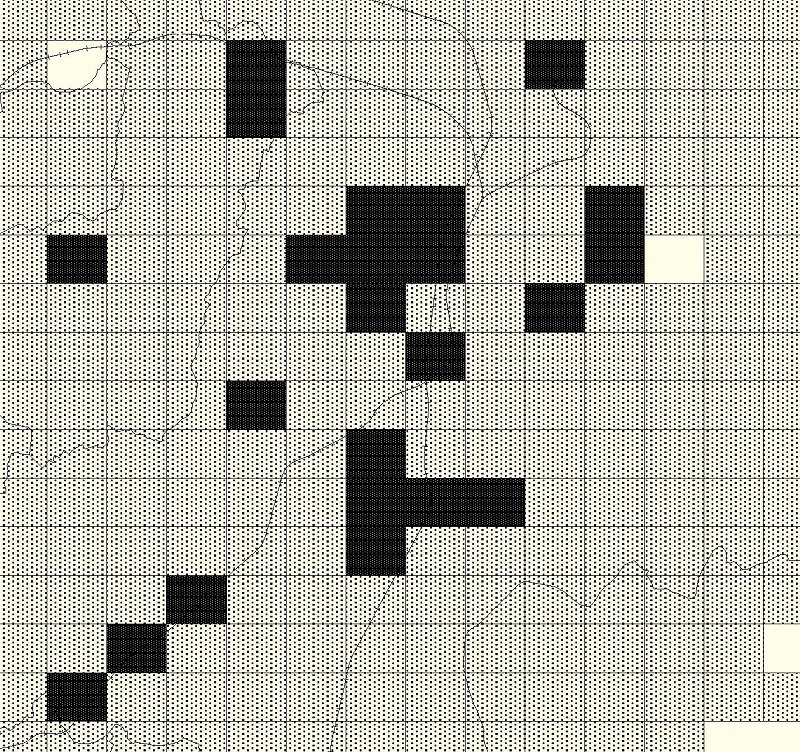
- Confirm the land purpose of those adjacent to 5,000 people square grids with a regular map.
- When those adjacent lands are occupied with factories or ports, then they should be considered as parts of the urban area.
- For rivers, mountains and forests, likewise.
The map below shows the newly defined urban area of Toyota-city, using
the aforementioned rules.
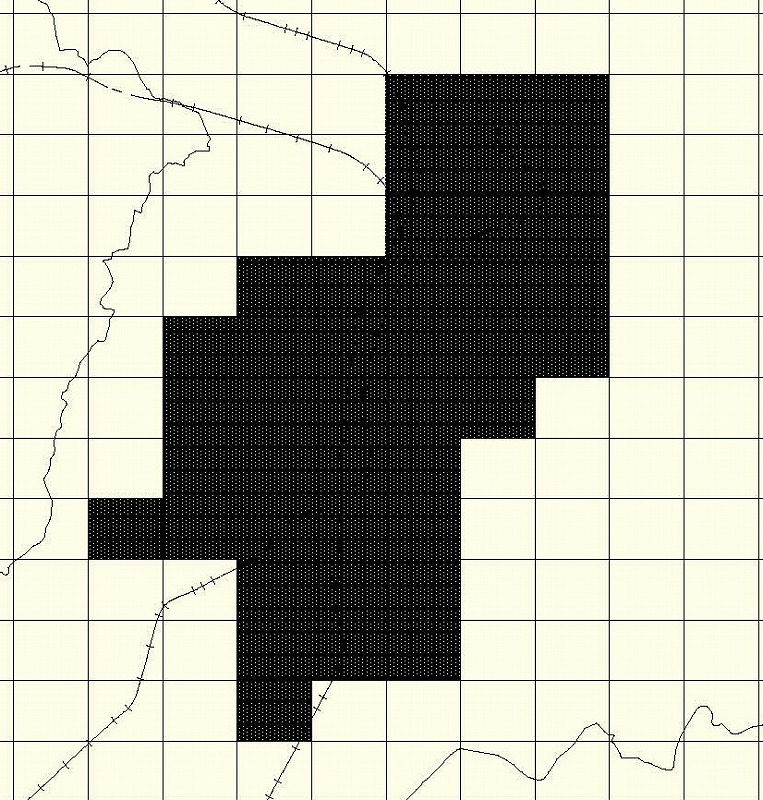
Based on the grid square data of 5,000 people/km2, metropolitan areas and other cities are defined by the aforementinoed rules.
![]()
ConTAct us AT
Prof. Kazushi Tamano
2-11 Wakaba Mihama-ku
Chiba-City, Chiba, Japan 261-8586
(The Open University of Japan)
tamano@k.email.ne.jp