Create Scatter Plots - ScatterMaker
Have you ever struggle to create beautiful scatter plots?
When you need to check distribution of your data, scatter plots may be suitable. However, it is really dificult to create a beautiful scatter plot using Microsoft Excel, or other popular applications for graphs at a reasonable price.
Here is a simple application for scatter plots.
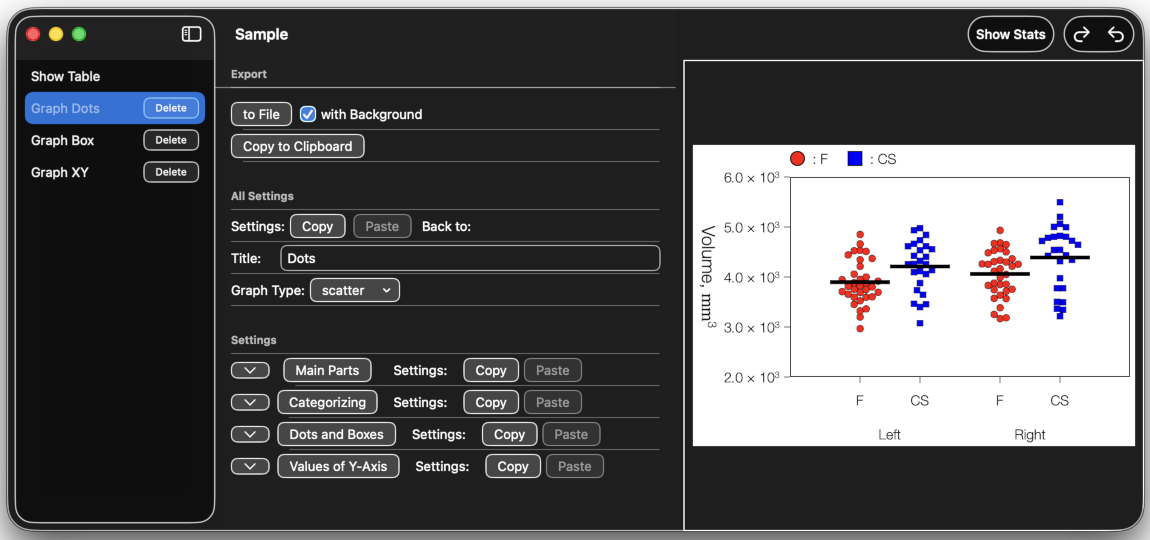
The aim of this application is to check the distribution of data. ScatterMaker will make scatter plots.
You can adjust overlap of dots for comparisons between groups. You can know distribution of your data intuitively.
ScatterMaker will use tables, which are also use by popular applications for the statistical calculation. ScatterMaker can divide data into groups automatically, if you want.
It can show basic descriptive statistics values or results of some statistical tests.
Available on Mac and iPad

ScatterMaker 6 Now Available for macOS and iPadOS
Aug. 6, 2026
- ScatterMaker returns with support for the latest operating systems and is now also available for iPad.
- On macOS, files created with previous versions are also supported.
- Requires macOS Tahoe 26.1 or later, or iPadOS 26.1 or later.
6.1
Sep. 22, 2026
- Added iCloud support for seamless integration with macOS and iPad.
- Fixed an issue where the app could stop working properly after copying a document.
Version History
6.0
July 17, 2026
- Added support for iPad as well as macOS.
- Redesigned the user interface.
- Improved scatter plots so that all plot symbols have the same area regardless of their shape, reducing the visual bias caused by different marker shapes.
- Added the ability to export all graphs in a document to a single PDF operation.
- Added support for opening files created with some previous versions.
5.0
- Fixed a critical issue that prevented graphs from being exported correctly on some operating system versions.
- Now supports macOS Catalina 10.15.6 or later.
- Improved the user interface.
4.5
- Added support for two-dimensional scatter plots to examine the correlation between two variables.
- Added support for independent two-sample t-tests (Welch's t-test and Student's t-test), paired t-tests, effect sizes, and Pearson's correlation coefficient.
- Improved the user interface.
4.4
- Improved the stability of the graph settings table.
- Significantly improved the rendering speed when displaying large numbers of plot symbols (approximately 25% faster).
- Fixed several issues, including problems with copying graph settings.
- Resolved memory leaks.
4.3
- Now supports macOS Sierra 10.12.2 or later.
- Redesigned the user interface.
- Adopted a one-window-per-document design.
- Made graph setting labels easier to understand.
- Improved copy-and-paste behavior within the application.
- Added built-in application help.
4.2
Unfinished.
4.11
- Fixed a crash that occurred when opening scatter plots saved with BarType = 0 (bars hidden).
- Greatly improved graph rendering performance, especially for graphs containing large numbers of plot symbols.
- Fixed an issue where the graph window occasionally appeared blank.
- Improved the behavior of copying and pasting graph settings to better match user expectations.
- Prevented users from selecting fonts that could not be displayed correctly when plot symbols were rendered using fonts.
- Added a warning when plot symbols or other objects extend outside the graph frame.
- Made graph setting labels easier to understand.
- Various other bug fixes and improvements.
4.1
- Fixed a critical issue where changes made after reopening a saved document were not saved.
- Fixed crashes that could occur when copying or pasting table data.
- Fixed an issue where undoing the deletion of X-axis text did not redraw the graph.
- Added descriptive statistics.
- Implemented the Shapiro–Wilk test and the Kolmogorov–Smirnov test for normality testing (not available in Demo mode).
- Added support for box plots as an alternative to scatter plots, particularly for datasets with very large numbers of observations.
- Displayed graph settings within the same window.
- Fixed an issue where importing table data could overwrite columns used by graphs.
- Various other improvements.
4.0
- Added support for OS X Yosemite.
- Completely redesigned the application (not compatible with previous versions).
- Added logarithmic transformation.
- Expanded the range of configurable settings.
- Various other improvements.
3.0
Unfinished.
2.0
- Fixed a display issue affecting tables. This issue did not affect the data used for graph generation.
- Fixed a crash that occurred when empty categories were present while creating graphs.
- Added support for creating and editing tables by pasting data as well as manual editing, together with a redesigned table layout.
- Added the ability to save tables and graph settings in addition to graphs.
- Redesigned the settings screen.
- Various bug fixes and user interface improvements.
1.01
Fixed an issue when loading tables with inconsistent numbers of data items. Compiled for Mac OS 10.5.
1.0
Initial release.