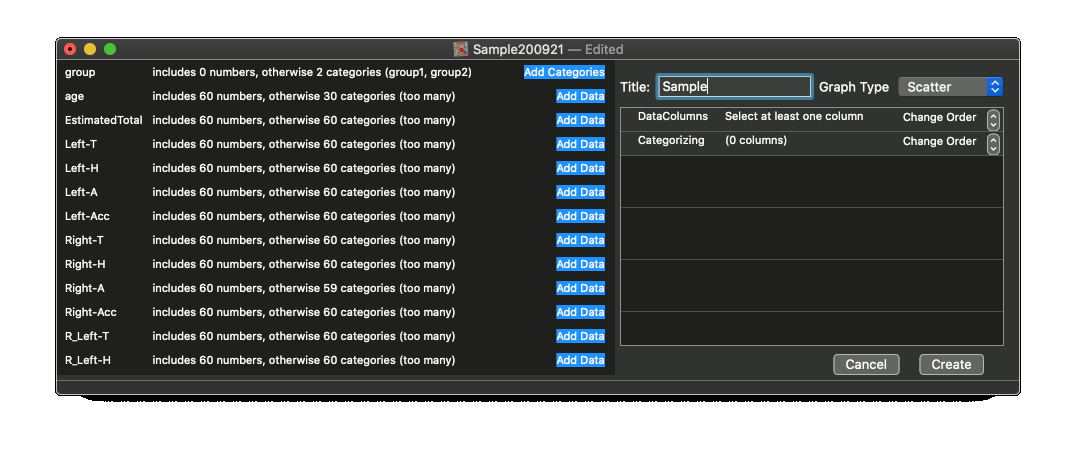
Click the "Add New Analysis" button at the top of the document window. The configuration view will appear.

The outline table where you can select variables at the top of the document. You will select variables from a data table of a summary table at the top of the document. These actions do not support an undo function.
Click the "New Analysis" button and make new blank analysis. Add a variable a "DataColumns" or "Categorizing" column.
Data will be classified according to "DataColumns" and/or "Categorizing" columns. For example, in the above figure, data will be classified by data columns, then into two groups ("group0" and "group1"). You can change the order of levels only here. To change the order, select the target row and click the step button in the right side.
In the above figure, data will be classified into two groups ("group0" and "group1"), then classified by data columns.
If you do not use specific label, uncheck the "Use" checkbox. This operation can be done only here.
When it is ready and you want to see your graph, click "Create". Once a graph is generated, you cannot change settings here unless the "Modify" button is clicked. When the "Delete or Modify" button is clicked, your graph and configuration will be deleted, and undo stacks will be reset.