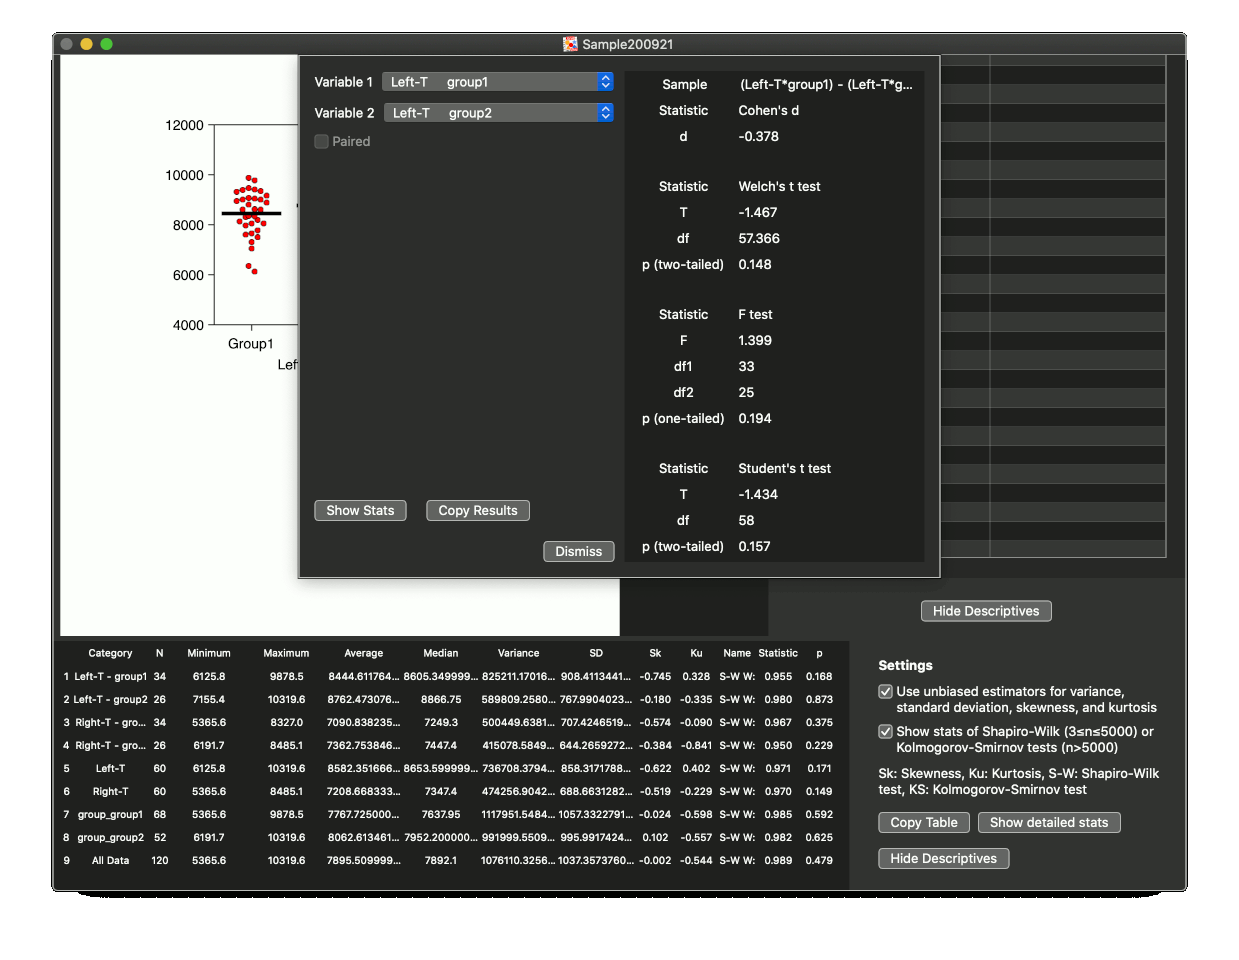
Show descriptive statistics
Click the "Show Stats" button on the top of the document when a graph is shown.
Statistical results for data groups of 3 types can be shown. The first type shows individual groups shown on the graph. For examples, the first 4 rows show those statistics of those groups. The label is "(a category of the first level) (one of the second level).....", such as "Left-H group1." The second type shows groups divided by a single level. For examples, the next 4 rows shows those statistics. "Left-H" and "Right-H" mean groups divided by data columns (the first level), and "group_group1" and "group_group2" means groups divided by the "group" column. The last type shows the statistics for all data used in the graph, which label is "All Data", when the type of a graph is "scatter" or "boxplot.
Variance, standard deviation, skewness, and kurtosis
In the default settings, a "Use unbiased estimators..." checkbox is checked and unbiased estimators are shown. If you are using sampling data from a population, you should use unbiased estimators. This means that you will almost use unbiased estimators.
Caution: Strictly speaking, the standard deviation is not the unbiased estimator. The square root of the unbiased estimator for the variance is used as with many popular spreadsheet applications and statistical applications to avoid confusion.
Test for normality
Results of tests for normality, which are Shapiro-Wilk test1) or Kolmogorov-Smirnov test2) can be shown. Shapiro-Wilk test is the most powerful3), and Kolmogorov-Smirnov test without Lilliefors's modifications is significantly less powerful especially when the sample size is small3). Thus Shapiro-Wilk test is preferentially used. Approximating algorithm for Shapiro-Wilk test can not compute its test statistic when the sample size is over 5,000. Kolmogorov-Smirnov test is used in this case. Basically, the results of test for normality is not absolutely robust. The author shows them as supplemental results with no guarantees. The references below includes approximating algorithm used in ScatterMaker.
1) Royston P: Approximating the Shapiro-Wilk W-test for non-normality. Statistics and Computing 1992: 2, 117-119.
2) Simard R, L'Ecuyer P: Computing the Two-Sided Kolmogorov-Smirnov Distribution. Journal of Statistical Software 2011: 39, 11.
3) Razali MN: Power comparisons of Shapiro-Wilk, Kolmogorov-Smirnov, Lilliefors and Anderson-Darling tests. Journal of Statistical Modeling and Analytics 2011: 2, 21-33.
Copy the table
This table can be copied, and will be pasted to another application. The data will be copied in plain text format. Copied data always include names of variables.
Options for statistics
A view for advanced statistics, such as effect size, t test, or Pearson's correlation, will appear when you click "Show detailed stats." Choose groups which you prefer. A sample below for group comparison. You can select "paired" test, if applicable.
