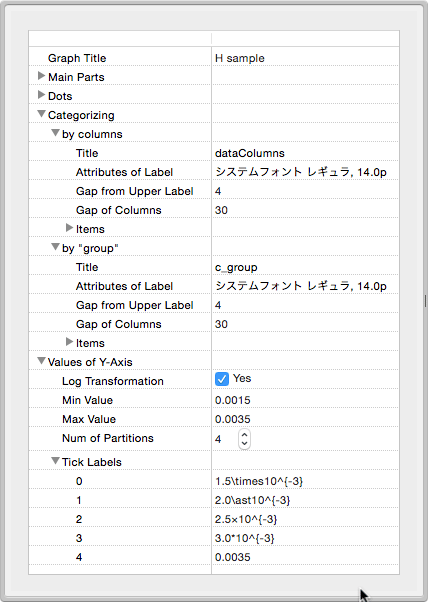
All settings can be changed on the outline table at the right of the graph. Currently, only a few items support other ways for setting.

When you want to set a string item, click the cell and type strings. If you set a font item, use a system font panel, which will appear after select the row. In case of a color item, select the row then click the color well button.
You can also use "copy & paste" function. You must paste data of the same type as the copied item (string to string, bool to bool, font to font, or color to color). Items with subitems also support "copy & paste" function. Multiple items can be set altogether. ScatterMaker will ignore some items, which cannot be set (e.g. items in "Values of Y-Axis"), if it works as the author intended.
In the graph, you can rewrite and change font in text fields directly. When you finish rewriting, click another view except text views. After clicking it, the rewritten text view will be rearranged according to its new size. If you press a return key, ScatterMaker will make a new line in the text view.
Several items were explained briefly below.
You can configure the size of the graph view at the "Background View" of the "Main Parts" item. If the value of the "Size follows PageSetUp" item is YES, The size will follow the page size, which you set the value in the "Page Setup..." dialog, or the default page size. If you need to change the size manually, set NO to the "followPageLayout" item, then change the width or height. You may need to run "Page Setup..." to print the graph properly, when the document is newly opened.
Set a value of the"Width of Column" item of the"Rectangle View" item of the "Main Parts" item. It means the given width of a group of dots.
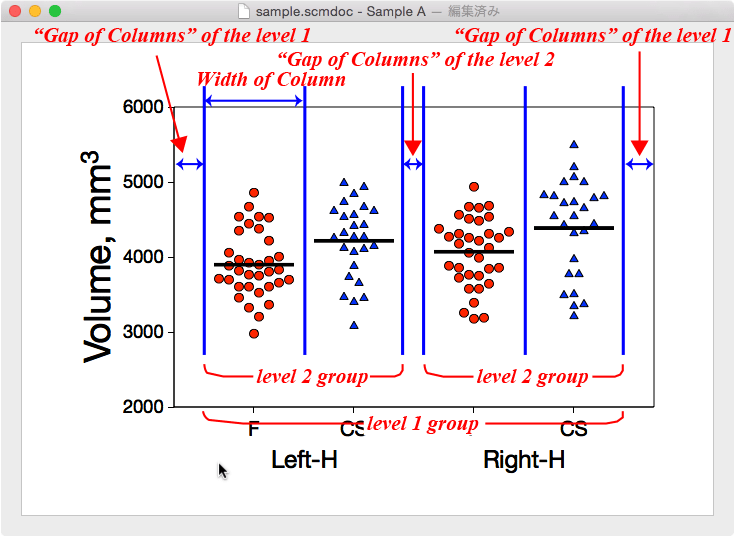
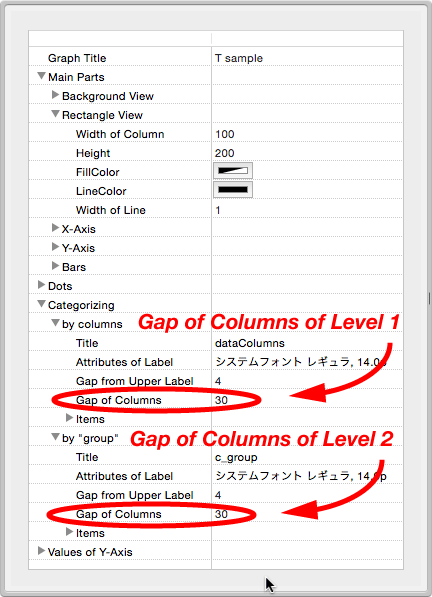
The width of the graph will be computed by the value of the "Width of Column" item and ones of "Gap of Columns" items, as described below.
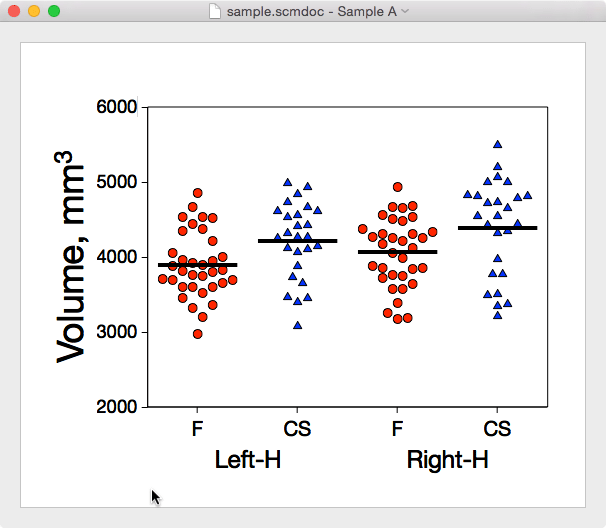
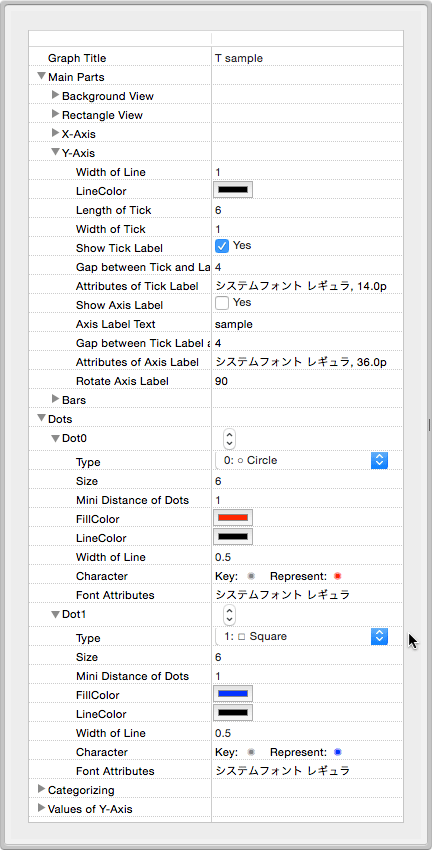
When you change a shape of dots, rewrite the "Type" item in the "Dots" item.
0: Circle
1: Square
2: Square, rotated by 90 degrees
3: Equilateral triangle
4: Equilateral triangle, rotated by 180 degrees
5: Star shape
6: Character
ScatterMaker uses "Character" and "Font Attributes" items only when the "type" item is set to "6". Set the "Character" when you change a character. You may use "Special characters..." menu item in "Edit" menu item. Set the "Font Attributes" item when you change font. You can set these properties in a text view in the "Graph" window directly. A setting of font size will be ignored. You can set size of dots in the "Size" item.
Set the "Mini Distance of Dots" item when you want to change the minimum distance of dots. This value means a ratio of the minimum distance to the dot size. That is, if you set this value to 1, dots may touch one another, but never overlap. If it is below 1, dots may overlap. Dots never touch one another, when it is more than 1. What will happen when it is set to 0? Dots will be arranged in a straight line regardless overlapping.
These items support copy & paste function.

Set each item in the "Categorizing" item. As mentioned in the previous section, you cannot change the order of levels. Vertical and horizontal gaps on the x-axis can be changed. If you need to change a title, change a value of the "Represent" item in the corresponding dict in the "Items" item. Titles can be rewrite in the "Graph" window directly. If you press the return key, ScatterMaker will make a new line of this text view. Click another view except text views when you finish rewriting. Details of the item of "Gap of Columns" are as follows.

Set each item in the "Values of Y-Axis" item. The value of the "Min Value" item must be the minimum value of all data or less. The value of the "Max Value" item must be the maximum value of all data or more. It includes the settings of logarithmic transformation. If data include 0 and less, logarithmic transformation cannot be used. The value of "Num of Partitions" item means number of divisions in scales. That is, the number of scales is the "Num of Partitions" value plus 1. Under the "Tick Labels" item, you can set scale manually. All "Tick Labels" values can be set freely and will be arranged according to their values automatically. Naturally, they must be the "min" value to "max" value. The "Tick Labels" item supports several types of notation (see the figure above). The author recommends to use the "Config" window for settings of the scale values, because text views in "Graph" window do not support settings of superscript.

Set items under the "Y-Axis" item in the "Main Parts" item. You can rotate a title of y-axis. A title of y-axis support notation as well as "Tick Labels" value. It also support subscript. For examples, if you need to show the chemical formula of the water molecule, set "H_{2}O" in the item "Axis Label Text".
Set the items under the "Bars" item of "Main Parts".
You can choose three types of bars.
0: nothing
1: average
2: median
The length of a bar will be computed according to the value of the "Length of Bar" item. It is the ratio of the length of a bar to the "Width of Column" value, described above. That is, it should be 0 to 1.