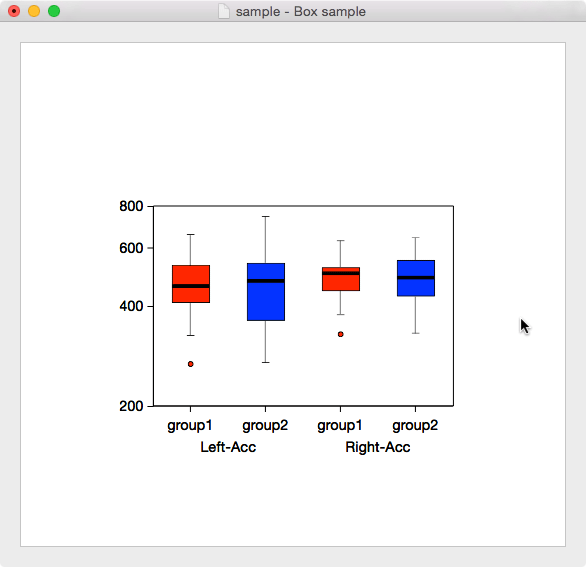
Scattergrams are the most appropriate to know the distribution of data, but you can make simple boxplots. The author strongly recommend scattergrams, but scattergrams may be slightly illegible and need more time to display if the sample size is extremely large. You can make boxplots alternatively.

Boxplots include box, whisker, and sometimes some outliers. The bottom and top of the box are the first and third quartiles, and the band inside the box is the median. The lower boundary of the whisker is the lowest value within 1.5 IQR (interquartile range), and the upper boundary is the highest value within 1.5 IQR. Outliers are values outside these boundaries.

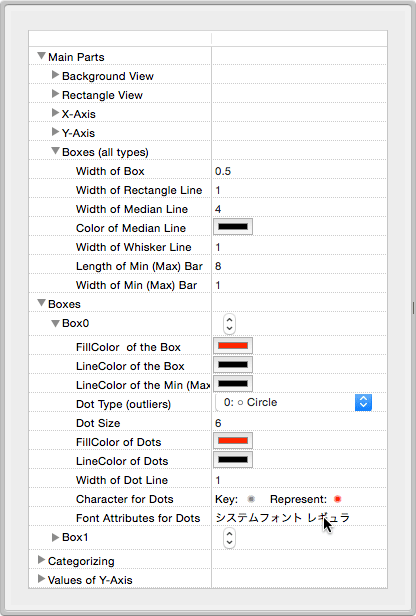
Setting methods for boxplots are similar to ones for scattergrams. The "Boxes (all types)" item in the "Main Parts" item and the "Boxes" item are pecular to boxplot configuration.
The width of a box will be computed according to the value of the "Width of Box" item in the "Boxes (all types)" item. It is the ratio of the width of a box to the "Width of Column" value, described in "Configure a scattergrapm. That is, it should be 0 to 1.