Modeling the Stress-Strain Response of Continuous Fiber
Reinforced Cement Composites
INTRODUCTION
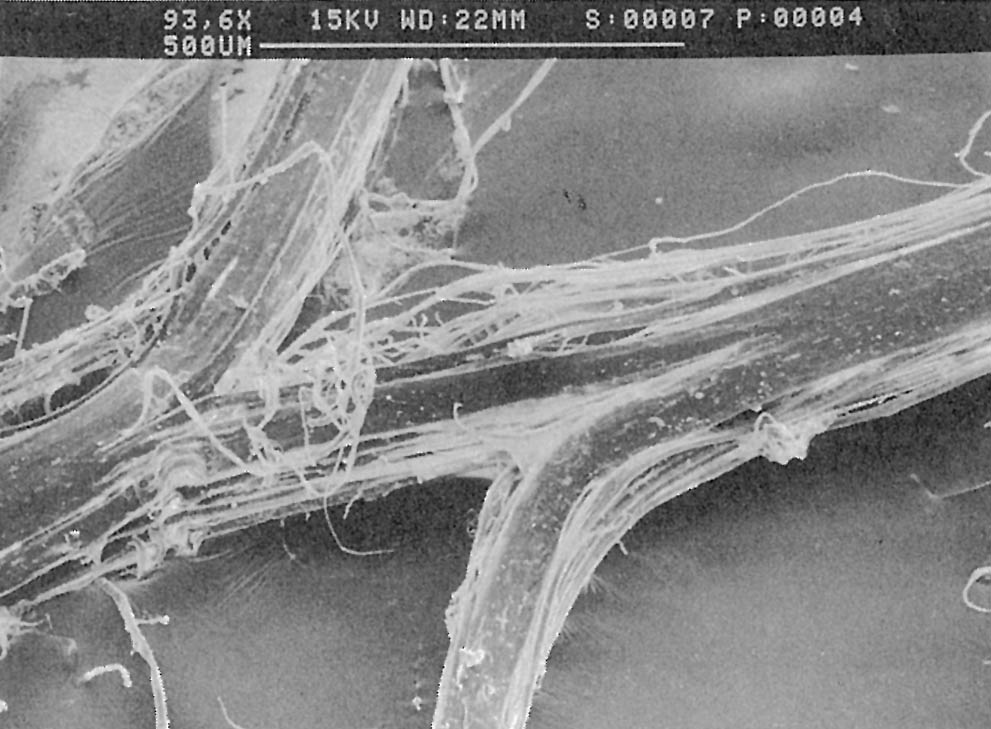
Since the 1960s, cement composites reinforced by short fibers and continuous fibers have been the subject of theoretical analysis based on understanding the bonding mechanism between the fibers and the matrix. Today, however, there is an increasing number of continuous fiber types that do not have a single valued interfacial bond shear strength and that are used in commercial composites. These fibers may consist of glass or polymer strands containing many individual filaments bound with a size, or polymer films that have hairy edges but split readily parallel to the polymer chain direction (Fig. 1). Both of these fiber types are used commercially on a large scale in Italy, where more than 2 million m2 of corrugated roofing and cladding sheets are now in service, containing a combination of continuous glass strands and fibrillated polypropylene networks. The tensile stress-strain curve for these composites is complicated by the bonding mechanism of both these fiber types, which have significantly different shear strengths at the fiber-cement interface and within the film or fiber bundle. For example, it has been shown that in a cement composite reinforced with fibrillated polypropylene fiber networks, shear slip within the fibers occurs during the tensile fracture process.1 It is also known that in glass fiber cement composites, the fibers on the surface of the strands are in direct contact with the cement matrix, but it may take some years before the cement hydration products penetrate to the center of the strand. In such cases, conventional theoretical models designed to take into consideration full elastic continuity at the fiber-matrix interface and frictional stress transfer at the interface have to be checked for their applicability. From a practical point of view, a simpler model is preferable, but it is also necessary to consider theoretical approaches that are tuned to the actual mechanisms to obtain a better understanding of the behavior of various composites. Such an understanding is likely to lead to improvements in those composites and to enable the development of applications that utilize their characteristics more effectively. In this study, the theoretical modeling of slip and stress transfer in the fibers or fiber strands will be discussed, and the tensile behavior predicted from such a model will be also reported.
RESEARCH SIGNIFICANCE
The maintenance of ductility after long periods of natural weathering is of crucial importance to the serviceability of fiber cements and to their acceptance by the engineering profession. This ductility may only be maintained by the achievement of filament shear slip within the interior of a glass fiber strand or at a constant stress for intermolecular chain slip within a polypropylene film. Conventional theory is not adequate to allow analysis of this problem in the multiple-cracking zone of the stress-strain curve and therefore improved theories, as described in the following section, are necessary.
CONVENTIONAL MODELS AND THE PHENOMENA OCCURRING IN COMPOSITES DURING THE TENSILE FRACTURE PROCESS
Typical models of fiber-matrix stress transfer in a cement composite reinforced with continuous fibers include one that assumes elastic continuity at the fiber-matrix interface, 2, 3 a second that takes into account the stress transfer by frictional bonding, 4 and a third that is a combination of these two. 5 A model derived by Aveston, Cooper, and Kelly, known as the ACK theory, assumes that stress transfer between fibers and matrix is caused by frictional stress, and that the fibers and the matrix can move· freely relative to each other. The stress-strain curve for a composite predicted by this model is typically in the form of a tri-linear curve, as shown in Fig. 2. On the other hand, if the assumption is that elastic continuity is maintained between the fibers and matrix, 2 the stress-strain curve shows a smooth increase in stress in the multiple-cracking region. In contrast, Laws, Lawrence, and Nurse5 carry out their analyses based on the assumption that elastic continuity is maintained where bonds are not broken at the fiber-matrix interface, and that frictional bond stress transfer occurs 'where the bonds fail. Predictions resulting from such a model show a smooth rise in stress in the multiple-cracking region. Detailed summaries of recent modifications to these original theories and some new approaches are given in References 6 and7.
These theories provide a rough account of the behavior of cement composites reinforced with continuous fibers consisting of monofilaments. However, when composites with a complex structure such as those containing fibrillated polypropylene fibers are under tensile load, more complicated phenomena occur at the microscopic level. These phenomena affect the behavior of the composite, but sometimes conventional theoretical models have no explanation for such changes in the behavior.FIBER TYPES MODEL
FIBER TYPES MODELED
Two fiber types were considered. One fiber type is continuous fibrillated polypropylene film which is made from a highly stretched (15:1 draw ratio) polymer before being partially split parallel to the molecular chains in a pin-roller. This results in a filament of approximately rectangular cross section, which is strong and stiff in the direction of the aligned polymer chains but weak and easily split or sheared between the chains. Fig. 1, 3, and 5 show these fibers. The other fiber type consists of strands made from many individual filaments bound with a polymer size that fills the space between the filaments. Thus, the inner filaments may slip at a different shear stress from the outer filaments which are in direct contact with the cement. These fibers are shown in Fig. 5.
Microscopic observations of the fracture processes of polypropylene fiber reinforced cement, and the various phenomena occurring at the fiber-matrix interface and inside the fibers, have been reported by the authors.1 Fig. 3 shows the fibers and matrix in a specimen under a tensile load, and the very thin black line which is fixed to the surface. The fracture of this line indicates the occurrence of slip inside the fibers. Such slip within the fibers suggests an uneven stress distribution in the fiber cross section, and is thought to affect the mechanical behavior of composites. Although there are other factors such as a reduction in the elastic modulus of the polymer at high strains which need to be taken into consideration for an understanding of fibrillated polypropylene fiber reinforced composites, the slip previously described is a basic and significant phenomenon in the study of the mechanisms of stress transfer. The same slip phenomenon may occur in composites reinforced with fibrous strands made from many monofilaments. A photomicrograph (Fig. 5) of the cross section of a glass fiber reinforced cement shows direct contact between the fibers at the surface of the fibrous strand and the cement matrix, while there is less contact with the fibers at the core of the strand. There is a difference in shear strength between the outside of the strand and the matrix and between the individual filaments in the core, which makes a difference in stress distribution; thus the occurrence of a phenomenon similar to that in the preceding case of polypropylene fiber can be expected.
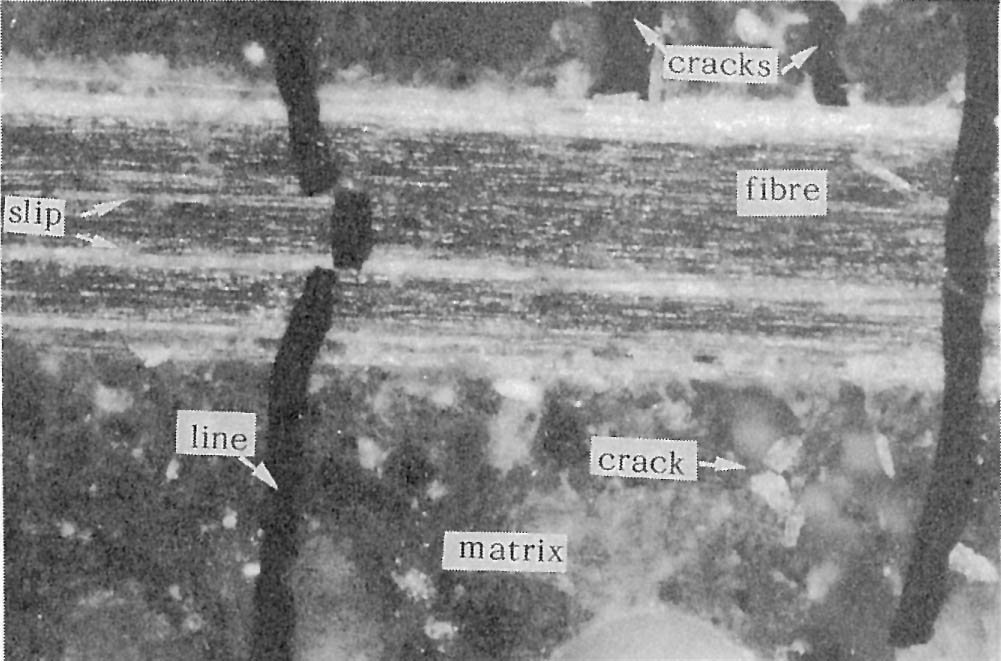
Fig. 3 - Slip in the fibrillated polypropylene fibers under tensile loading
Fig. 4 - Simplified cross section of the fiber and assumption of slip face in the fiber
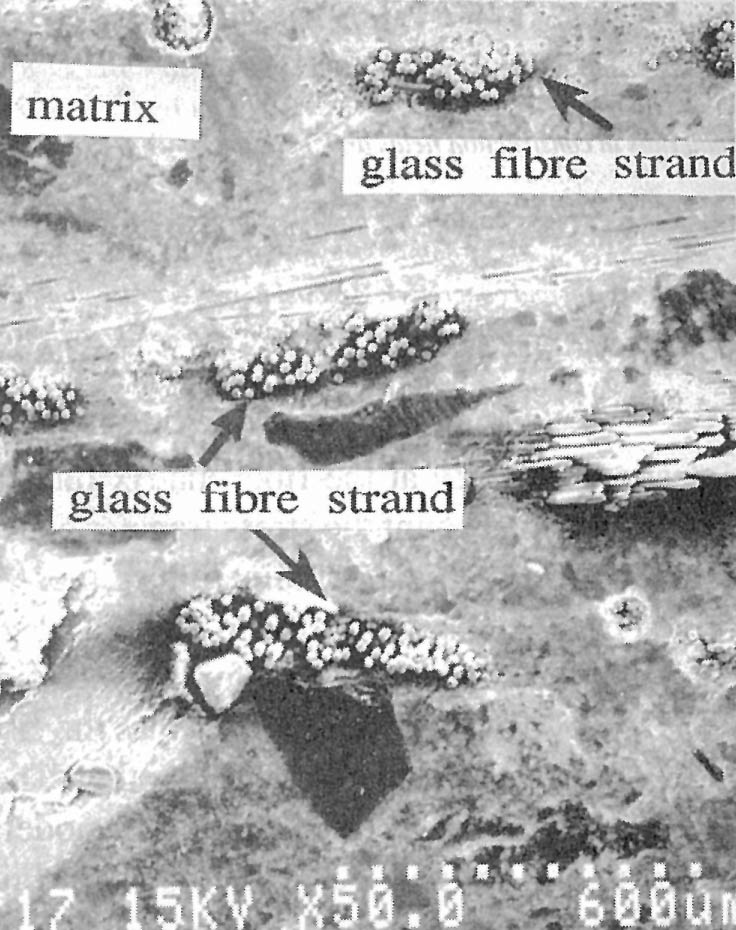
Fig. 5 - Cross section of glass fiber cement
CONCEPT AND ASSUMPTIONS OF THE MODEL
The aim of this study is to create a model of stress transfer as shown in Fig. 3, which takes slip in the fibers into consideration. As prerequisites for theoretical model creation, certain assumptions need to be made, and our model will be based on assumptions in the ACK theory, as follows.
1. The composite follows the mixture law until the matrix cracks. The fibers and
matrix behave as an elastic body.
2. Slip in the fibers occurs after cracking, and in this state, the fiber and matrix
freely move relative to each other.
3. Fibers located inside the slip face (core-fiber) and those outside (sleeve-fiber)
move independently.
4. Stress transfer at the fiber-matrix interface and the fiber-fiber interface occurs
through the transfer of constant stress per unit area over each interface.
5. The stress transfer at the fiber-matrix interface is greater than that at the fiber-
fiber interface.

STRAIN DISTRIBUTION IN THE COMPOSITE AND DEVELOPMENT OF EQUATIONS
Strain distributions in the fiber and matrix just after cracking
Fig. 6 shows the strain distribution near a crack face just after the matrix has cracked. When cracking occurs, the continuity of the matrix at the crack face is destroyed, and, as a consequence, the strain and stress in the matrix become zero at the crack face. All stress is therefore sustained by the fibers. Since the model assumes the occurrence of slip between the core-fibers and the sleeve-fibers, the core fibers and the sleeve-fibers carry different loads; thus, they deform according to their individual stress transfer capacity. When considering the strain distribution in the fibers and matrix, one must provide the following:
1. A relational expression of the bond stress transfer between the matrix and sleeve-fibers in the region from 0 to xiEq. (1) is given by the bond force (bond stress ti x perimeter of the fiber Pi, x transfer length Xi x the number of fibers N =Vj/Af ) transferred from the sleeve-fiber to the matrix in the region between the crack face and the transfer length Xi, being equal to the additional load on the matrix (modulus of elasticity of the matrix Em x volume fraction V m x strain efsi ) where the volume' fraction is commonly used instead of the area of the matrix.
2. A relational expression of the bond stress transfer between the sleeve-fiber and the core-fibers in the region from 0 to xf.
Eq. (2) is derived from the bond force (bond stress tf x perimeter of the slip face Pf x transfer length xf x the number of fibers) transferred between the sleeve-fiber and the core-fiber in the region between the crack face and the transfer length xf , 'being equal to the load increment applied to the core- fiber (modulus of elasticity of the fiber Ef x the volume or area fraction of the core-fibers (1 - k) Vf x the number of core-fibers x additional strain (efeo - emu).
3. An expression for the force balance at each cross section of the composite
At the crack face or at a given distance from the crack face, the sum of forces per unit area carried by the fibers and the matrix must be equal to the stress Ecemu sustained by the composite at a distance greater than xf from the crack face, thus giving Eq. (3), and at a distance xi from the crack face, thus giving Eq. (4) (See Fig. 6).
Similarly, the other parameters can also be obtained. Actual derivations are omitted.
The matrix strain is emuat a distance greater than xf from the crack face; hence, another crack is formed in that region. Therefore, as with the ACK model, cracking continues in the matrix until the composite splits into a series of blocks of lengths between xf and 2xf under a load equivalent to the cracking load. At this time, the average strain of the composite is equal to that of the fiber. According to Reference 3, the mean crack spacing will be 1.364xf, and, hence, the use of the efeo value in Eq. (6) gives the following
End of multiple cracking and stress increase
In this model, even under conditions where the crack spacing is less than 2xf, the interface of the sleeve-fiber and matrix has the ability to transfer further stress, because xi is shorter than xf. That is, with the increase in working stress, more cracks occur.
As shown in Fig. 8(a), with a crack spacing of greater than xi and less than 2xi, the matrix strain at the center of the cracked blocks is below emu. Fig. 8(b) shows the composite with a further increase in stress, giving the strain distribution in the fiber and the matrix. When the stress increases, that increase is sustained by the fibers alone at the crack face, resulting in an increase in efso and efeo, However, because the bond stress ti transferred at the sleeve fiber-matrix interface remains unchanged, the transfer length xi from the crack face extends to xi’. This means that the strain efsi’ of the sleeve fiber and the matrix increases to efsi’ at Point xi’. Since the bond stress tf at the slip face between the sleeve and core-fibers is constant, the strain of the matrix and the sleeve-fiber, in the region further than xi away from the crack face, increases with the distance from the crack face at the same rate as before the stress was increased. As a result, the matrix strain increases, and when this value reaches emu a new crack occurs nearly center between existing cracks. With new cracking, the areas on each side of the new crack come into a new equilibrium with a change in the strain of the fibers and the matrix. Hence, the matrix strain is maximized at the center between the cracks, causing more cracks in the matrix with each addition to the stress. If the working stress increases yet more, and the composite breaks into a series of blocks each measuring less than 2x i’, the fibers can transfer no more stress to the matrix. At this point, any further stress will be supported by the fibers only. Multiple cracking will cease when the composite is divided into a series of blocks with crack spacing of x i’ to 2xi.
Fig. 9 shows the strain distribution of the fibers and the matrix when the composite has cracks at intervals of 2x i’. As in the case discussed, the following equations can be derived from the equations for bond stress transfer between the matrix and the fibers, the equilibrium of force at each cross section of the composite, and the change in the fiber's deformation.
Fig. 8 - Strain distributions during multiple cracking: (a) cracks forming at spacing x < 2xf
Fig. 8 - Strain distributions during multiple cracking:(b) after further loading ( crack spacing < xf)
Fig. 9 - Strain distributions of fiber and matrix between cracks at crack spacing 2xf
Values of e’fso, e’fco,e ’fci, and x i’ can be obtained by solving these four linear equations, while e’fso is given by
COMPARISON WITH EXPERIMENTAL RESULTS
The equations proposed in this study involve a number of parameter such as G and Y, in which the major variables are k, a, and b. Determination of these three values can give values to other parameters in the equations as well as solutions to the equations themselves. The value of a, however, is used in the same manner as in the ACK theory, and the parameters unique to our model are k and b.
The value of ea increases with increasing b, and reaches an ultimate value of (1 - 0.659 a) emu. On the contrary, eb decreases from a value larger than (1- 0.659 a)emu to one closer to (1 - 0.659 a) emu as b increases. In other words, as the value of b increases, ea and eb converge according to the ACK theory, while as b decreases, the secondary multiple-cracking region increases. b expresses the ratio of bond stresses at the fiber-matrix interface and the slip face, and is thought to vary for the following reasons. Take, for example, a case where the matrix strength is high, then the value of b diminishes as ti becomes greater than tf. In other cases, where the number of hairs on the fiber surface increases, or the number of defects in the fibers increases during the process of fiber fibrillation, b is expected to decrease as well. That is, this model states that when a high-strength matrix or fibers likely to slip internally are used, the secondary cracking region of the stress-strain curve, denoted by A-B in Fig. 7, expands. The consequence of this is that the stress increase in that region becomes very apparent. When b is small, the stress which has to be sustained by the sleeve fiber rises considerably. As for the shape of the stress-strain curve, the secondary multiple-cracking region increases in size, resulting in a theoretical increase in the stress increment in that region. However, since the fiber strength is not limitless, this indicates that the sleeve fiber will fail first at a rather early stage. When the sleeve-fiber fails, it can be treated the same as the matrix. Therefore, for the condition after the sleeve-fiber breaking, this model will be the same as the ACK theory with its assumption that the bond stress at the interface is tf. To compare the proposed model with experimental results, we will use the type of fiber shown in Fig. 4.The cross-sectional shape of this fiber is rectangular, and a typical cross section is 150 x 10-6m on the longer side and 90 x 10-6m on its shorter side. The slip face is then assumed to be located at the point 15 x 10-6m from the shorter side. By estimating the frictional bond stress at each end of ti, the frictional bond stress acting on the side tis, and the bond stress acting on the slip faces in the fiber tf, the value of b is given by the following
Fig. 10 Comparison between the experimental and the model results
True values for bond stress are notoriously difficult to justify, but from our experiments on shear within films we have found tf to be 2 MPa. Typical values in the literature for tis for smooth polypropylene on cement are 1 MPa. The value of ti was estimated using an ACK model from the crack spacing of polypropylene fiber cement composite after tensile loading. For assumed fiber condition in Fig. 4, the value of ti was taken to be 5 MPa.
Using the preceding value for t gives the result for b equal to 0.5. Fig. 10 is a comparison between the results of a tensile test on a fibrillated polypropylene cement composite (Vf = 4.8,6.2, and 10.8 percent, high tensile strength, 10.5 to 12 MPa, matrix), for this model, and for values predicted by the ACK model. Predictions of the ACK model differ from the experimental results in terms of the end of the multiple-cracking region and the gradient of the post-cracking region.The results from this model, on the other hand, have a closer consistency than those of the ACK model with the experimental values, particularly in the region denoted A-B in Fig.7. However, this model is no better than the ACK model in its divergence from the experimental results in the gradient of the post-cracking region. This may be attributed to the effect of the failure of some fibers due to local stress. Calculation of the stress on the fiber at the end of the multiple-cracking region gives 410 MPa as the stress acting on the sleeve-fiber. This indicates that the fibers are stressed almost to their fracture strength. (Fiber strength in film tensile tests is about 400 MPa at a fracture strain of 6 percent.) If calculations are based on the assumption that the sleeve-fiber fails in the post-cracking region, the values calculated by this model will be closer to the experimental values (Fig. 10).
CONCLUSIONS
The comparison discussed previously confirms that the proposed model is appropriate to evaluate the stress-strain curve of a polypropylene fiber cement composite. The model developed in the study takes into consideration the bond stress transfer between the fibers and the matrix and at the slip face. The assumptions made were based on observations of the fracture process in polypropylene fiber cement, and the model is better able to explain the actual behavior of the composite than previous models. This model is also considered applicable to composites reinforced with fiber strands of many mono filaments bound by a relatively weak resin.
NOTATION
Em = elastic modulus of matrix
Ef = elastic modulus of fiber
Ec = elastic modulus of precracked composite
Vf = fiber volume fraction
Vm = matrix volume fraction
Vfs = volume fraction of sleeve-fiber
Vfc = volume fraction of core-fiber
k = Vfs/Vf, Vfc/Vf = (l-k)
Af = average cross-sectional area of a single fiber
N = number of fibers in unit volume of the composite N = Vi/Af
a = EmVm / EfVf
b = Pf tf / Pi t i
smu = matrix failure stress
efco = strain of core-fiber at crack face
efso = strain of sleeve-fiber at crack face
efci = strain of the core-fiber at the distance Xi from crack face
efso = strain of the outer sleeve-fiber at the distance x; from crack face
xi = stress transfer length at the fiber-matrix interface
xf = stress transfer length at the slip face in the fibers
emu = matrix failure strain
Pi = fiber perimeter
Pf = perimeter of slip face in fibers
ti = frictional shear stress between fiber and matrix
tf = transferred shear stress between sleeve-fiber and core-fiber
tis = frictional shear stress between the core-fiber and the matrix in the simplified cross section of polypropylene fiber cement
REFERENCES
1. Ohno, S.; Hannant, D. J.; and Keer, J. G. "Micromechanics of Stress Transfer between Fiber and Matrix in Polypropylene Fiber Cement Composites," Proceedings of International Conference on Composite Materials, Advancing with Composites, Milan, V. 1, May 1988, pp. 167-174.
2. Greszczuk, L. B., "Theoretical Studies of the Mechanics of the Fiber Matrix Interface of Composites," Interfaces in Composites, (ASTM STP 452), American Society of Testing and Materials, Philadelphia, 1969, pp. 42-58.
3. Aveston, J.; Mercer, R. A.; and Silwood, J. M., "Mechanism of Fiber Reinforcement o{Cement and Concrete," NPL, SI No. 90/11/98, Jan. 1975, p.103.
4. Aveston, J.; Cooper, G. A.; and Kelly, A., Single and Multiple Fracture: The Properties of Fiber Composites, Conference Proceedings of NPL Conference, IPC Science and Technology Press, Ltd., 1971, pp. 15-24.
5. Laws, V.; Lawrence, P.; and Nurse, R. W., "Reinforcement of Brittle Matrices by Glass Fibers," Journal Physics D: Applied Physics, V. 6, 1973, pp.523-537.
6. Bentur A., and Mindess, S., Fiber Reinforced Cementitious Composites" Elsevier Applied Science, 1990.
7. Balaguru, P. N., and Shah, S. P., Fiber-Reinforced Cement Composites, McGraw-Hill, 1992.